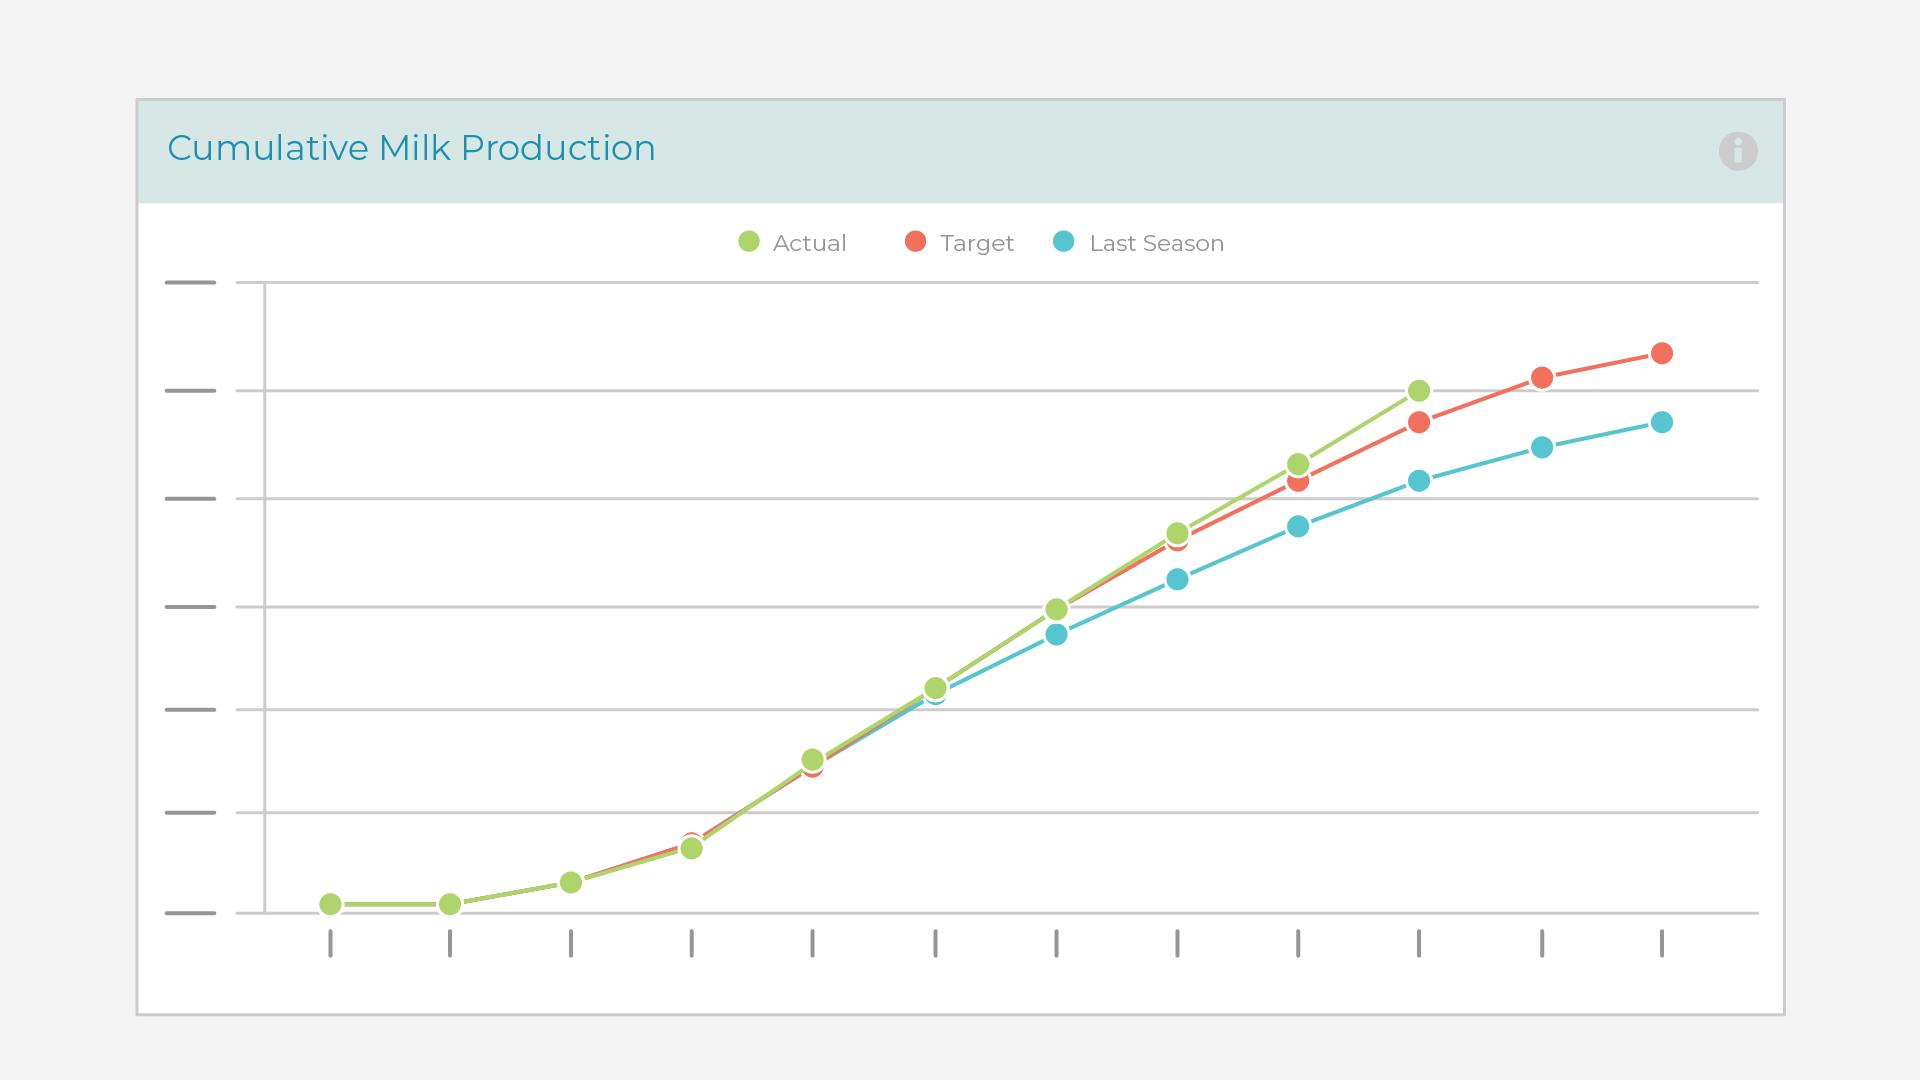
All your data on one dashboard.
Whether you’ve got one, five or fifty farms, monitor and compare performance across the board.
Prioritise your time with Trev.
Discover your data.
Stay on the front foot.
Action your insights.
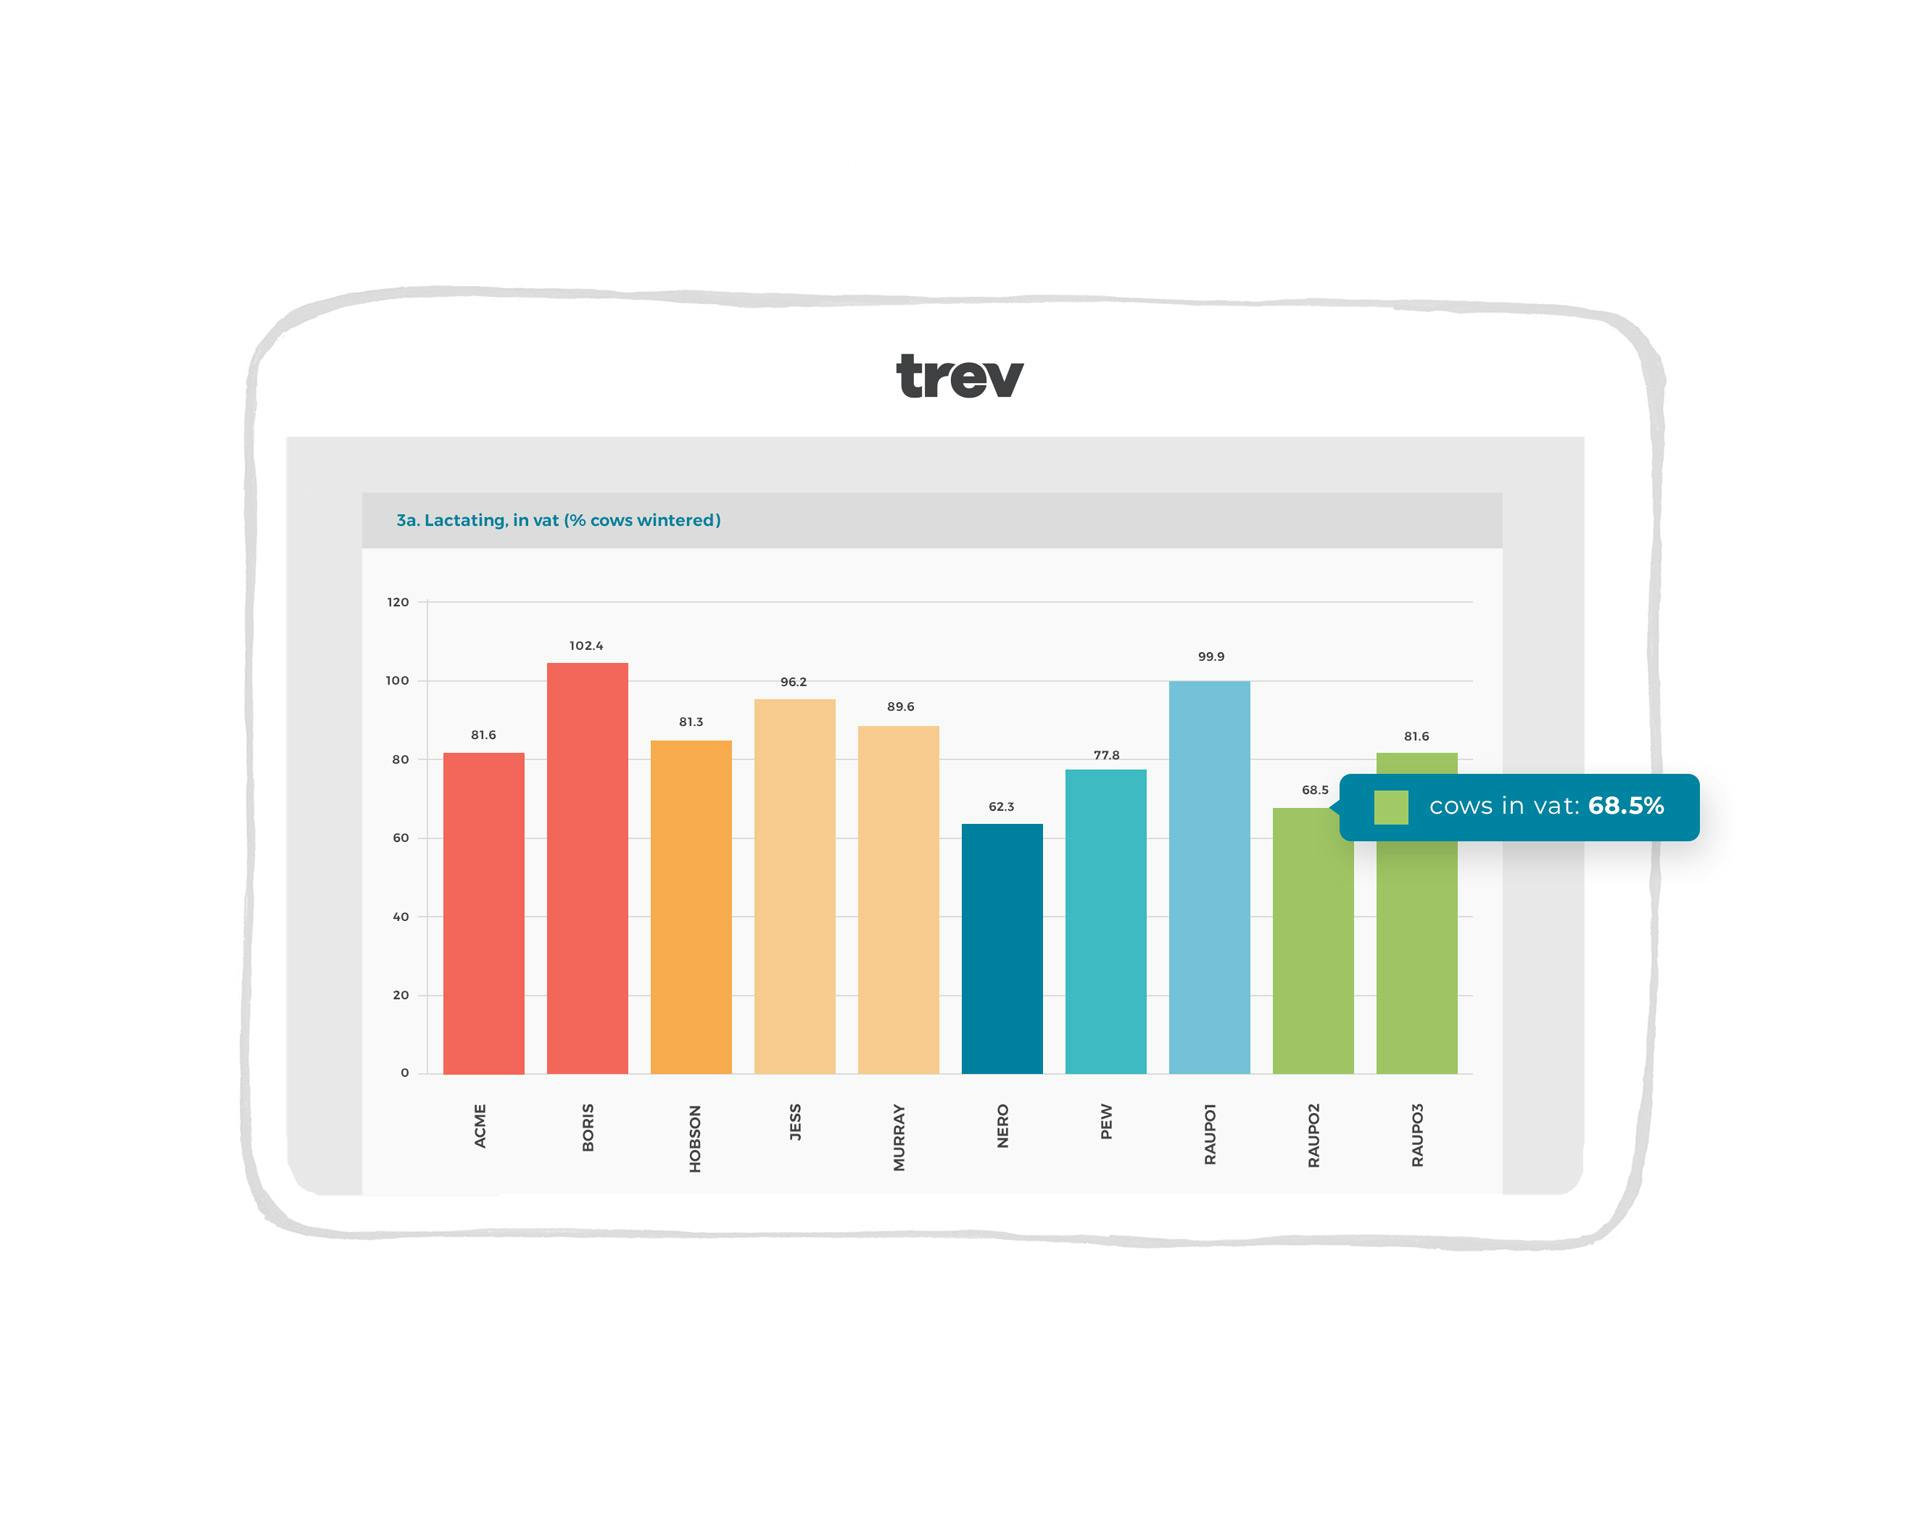
The benchmark for benchmarking.
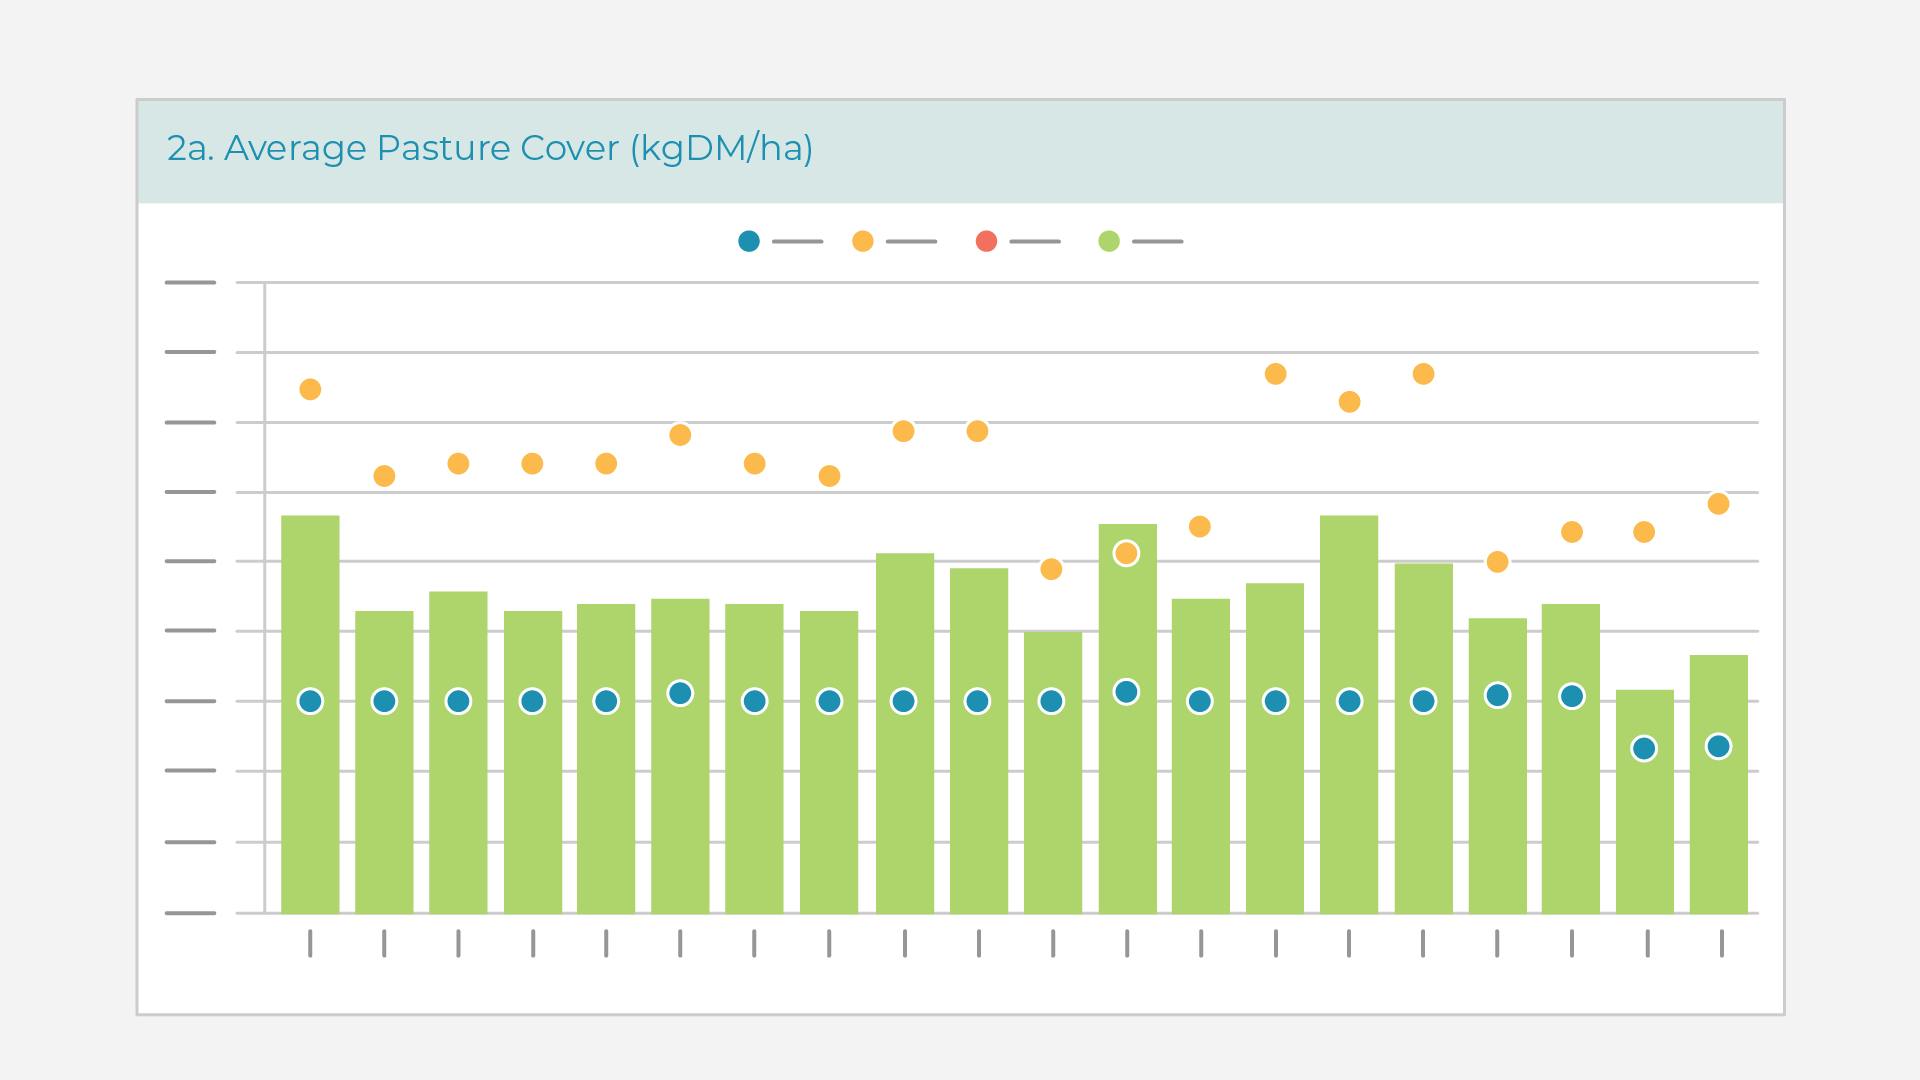
Keep eyes across your operation with visual benchmark reports and compare the performance of your farms across a range of farm specific KPIs. See how performance varies by system type, calving pattern, location or soil. Or compare metrics to find out which farms are outliers, and hone in on specific data to find out why.
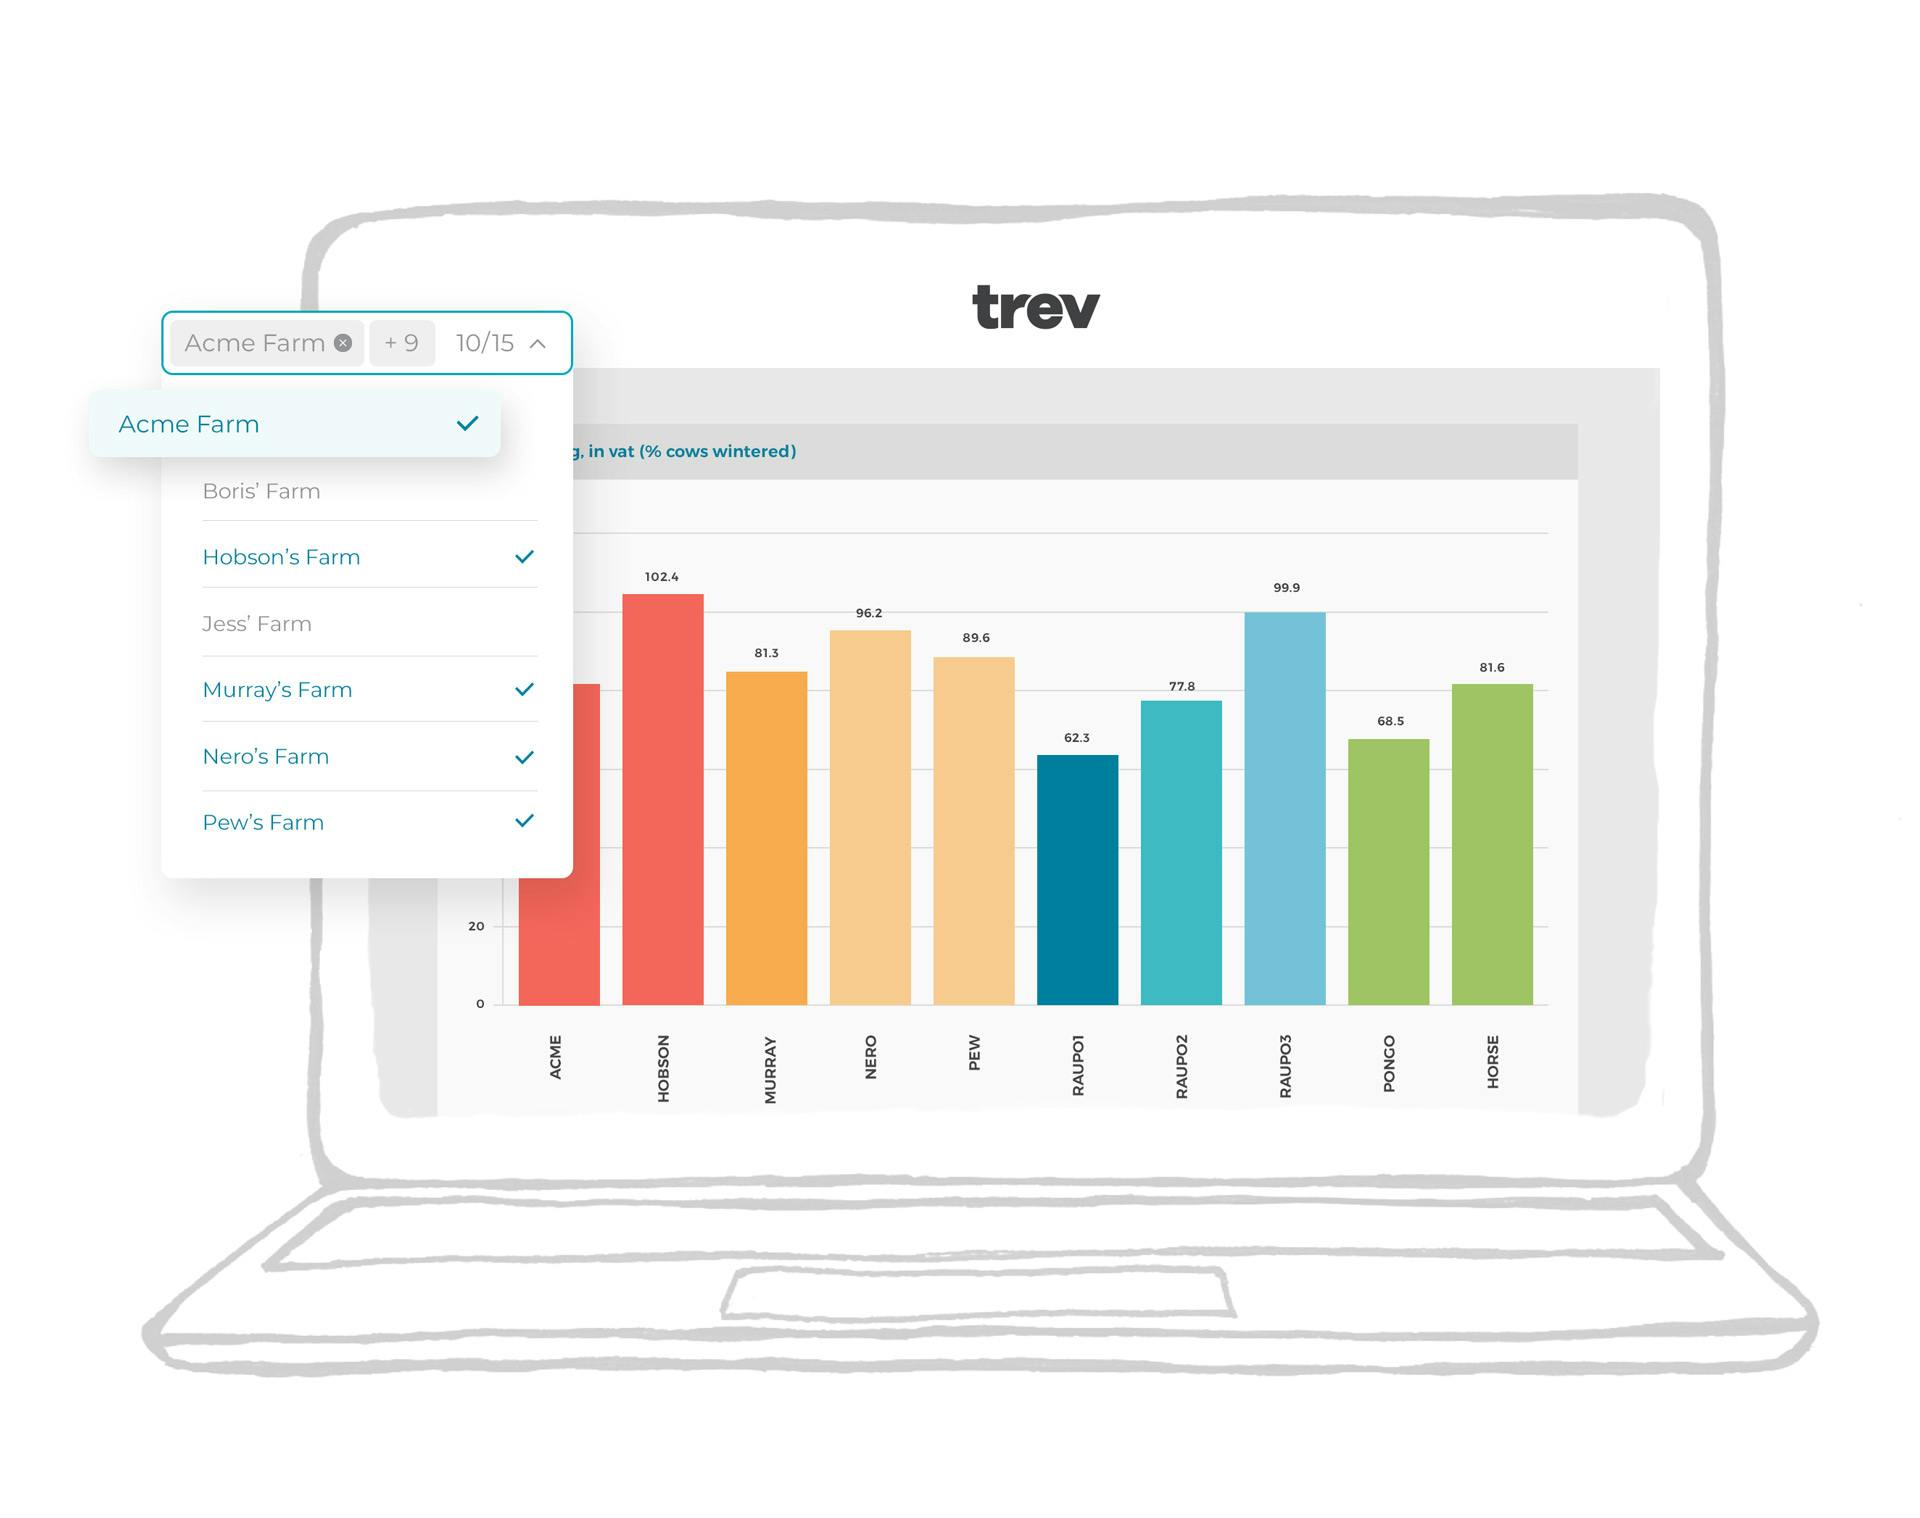
Drill down or stack up.
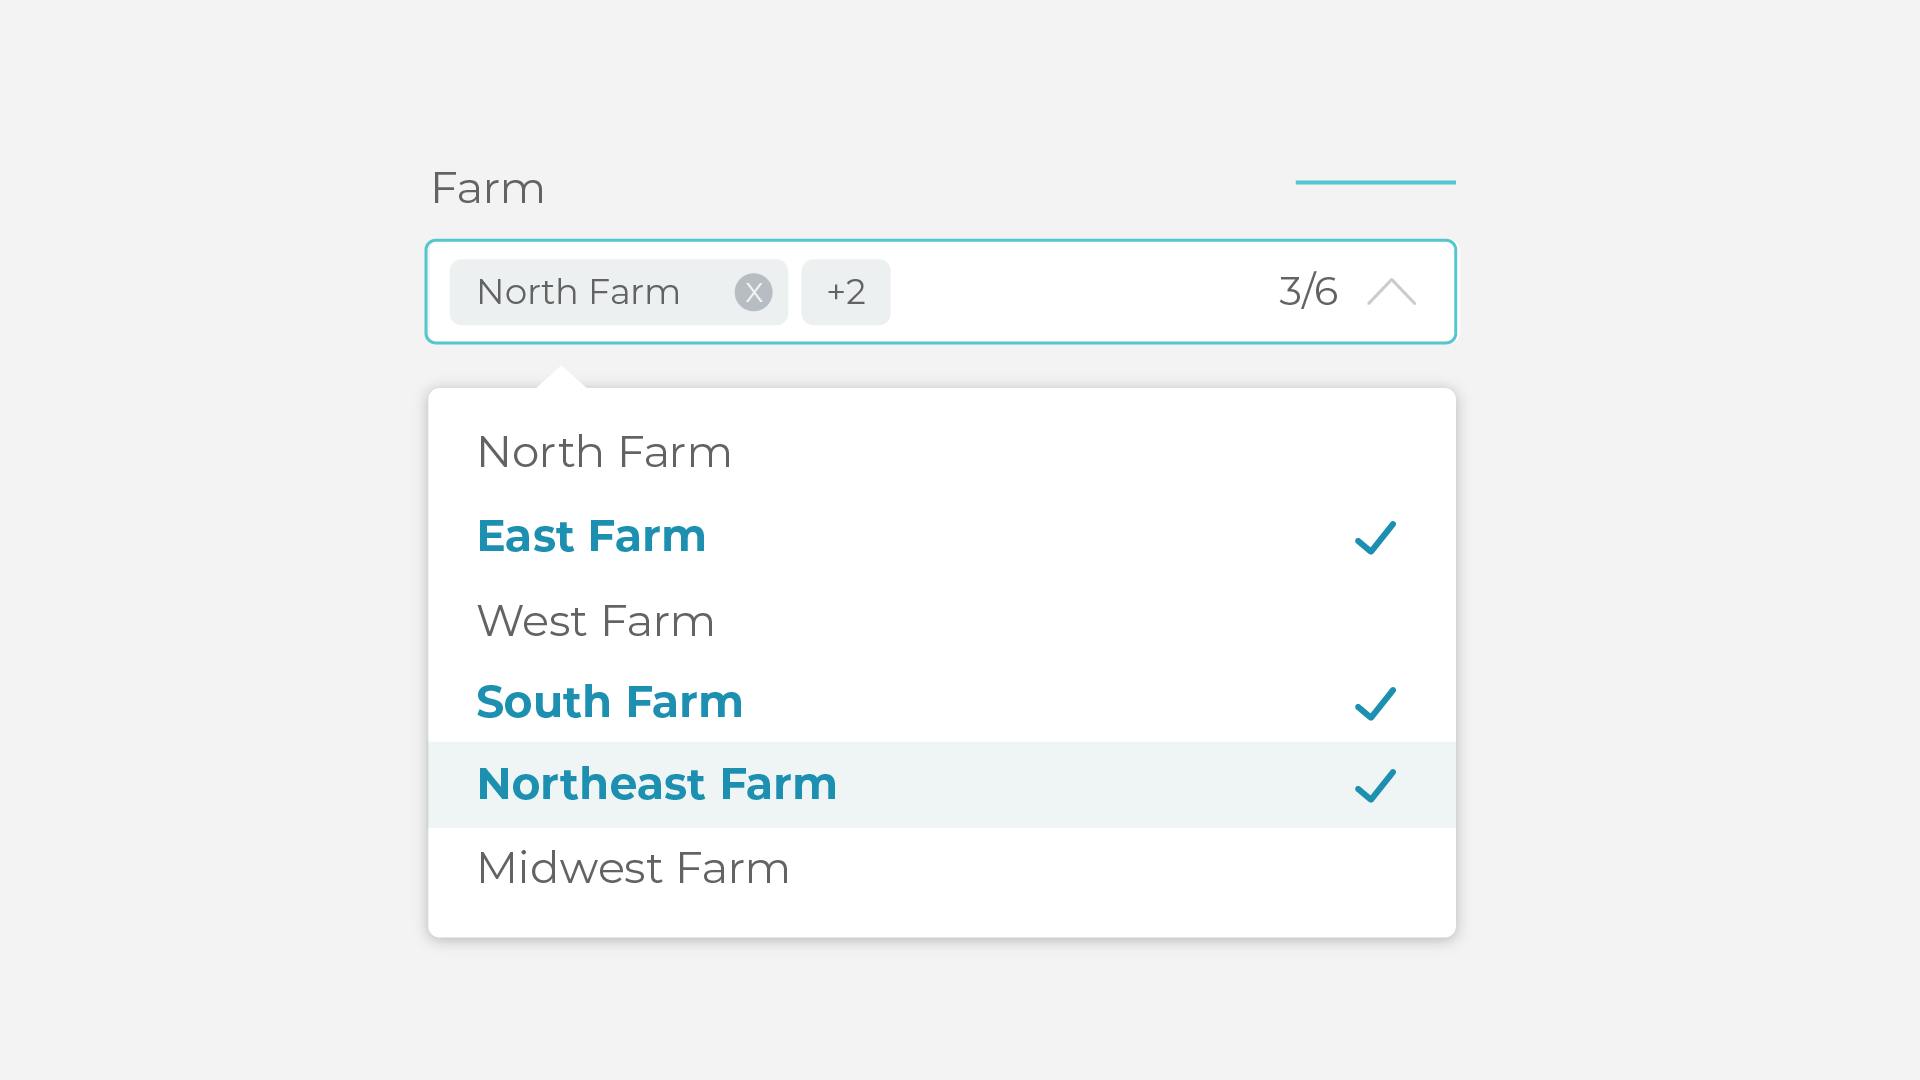
Once info starts flowing into Trev you can choose to break it down or build it up. Get down and dirty with raw data using custom filters to get exactly what you need. Or take a helicopter view and aggregate your operation to assess performance at a hub, region or company-wide level.
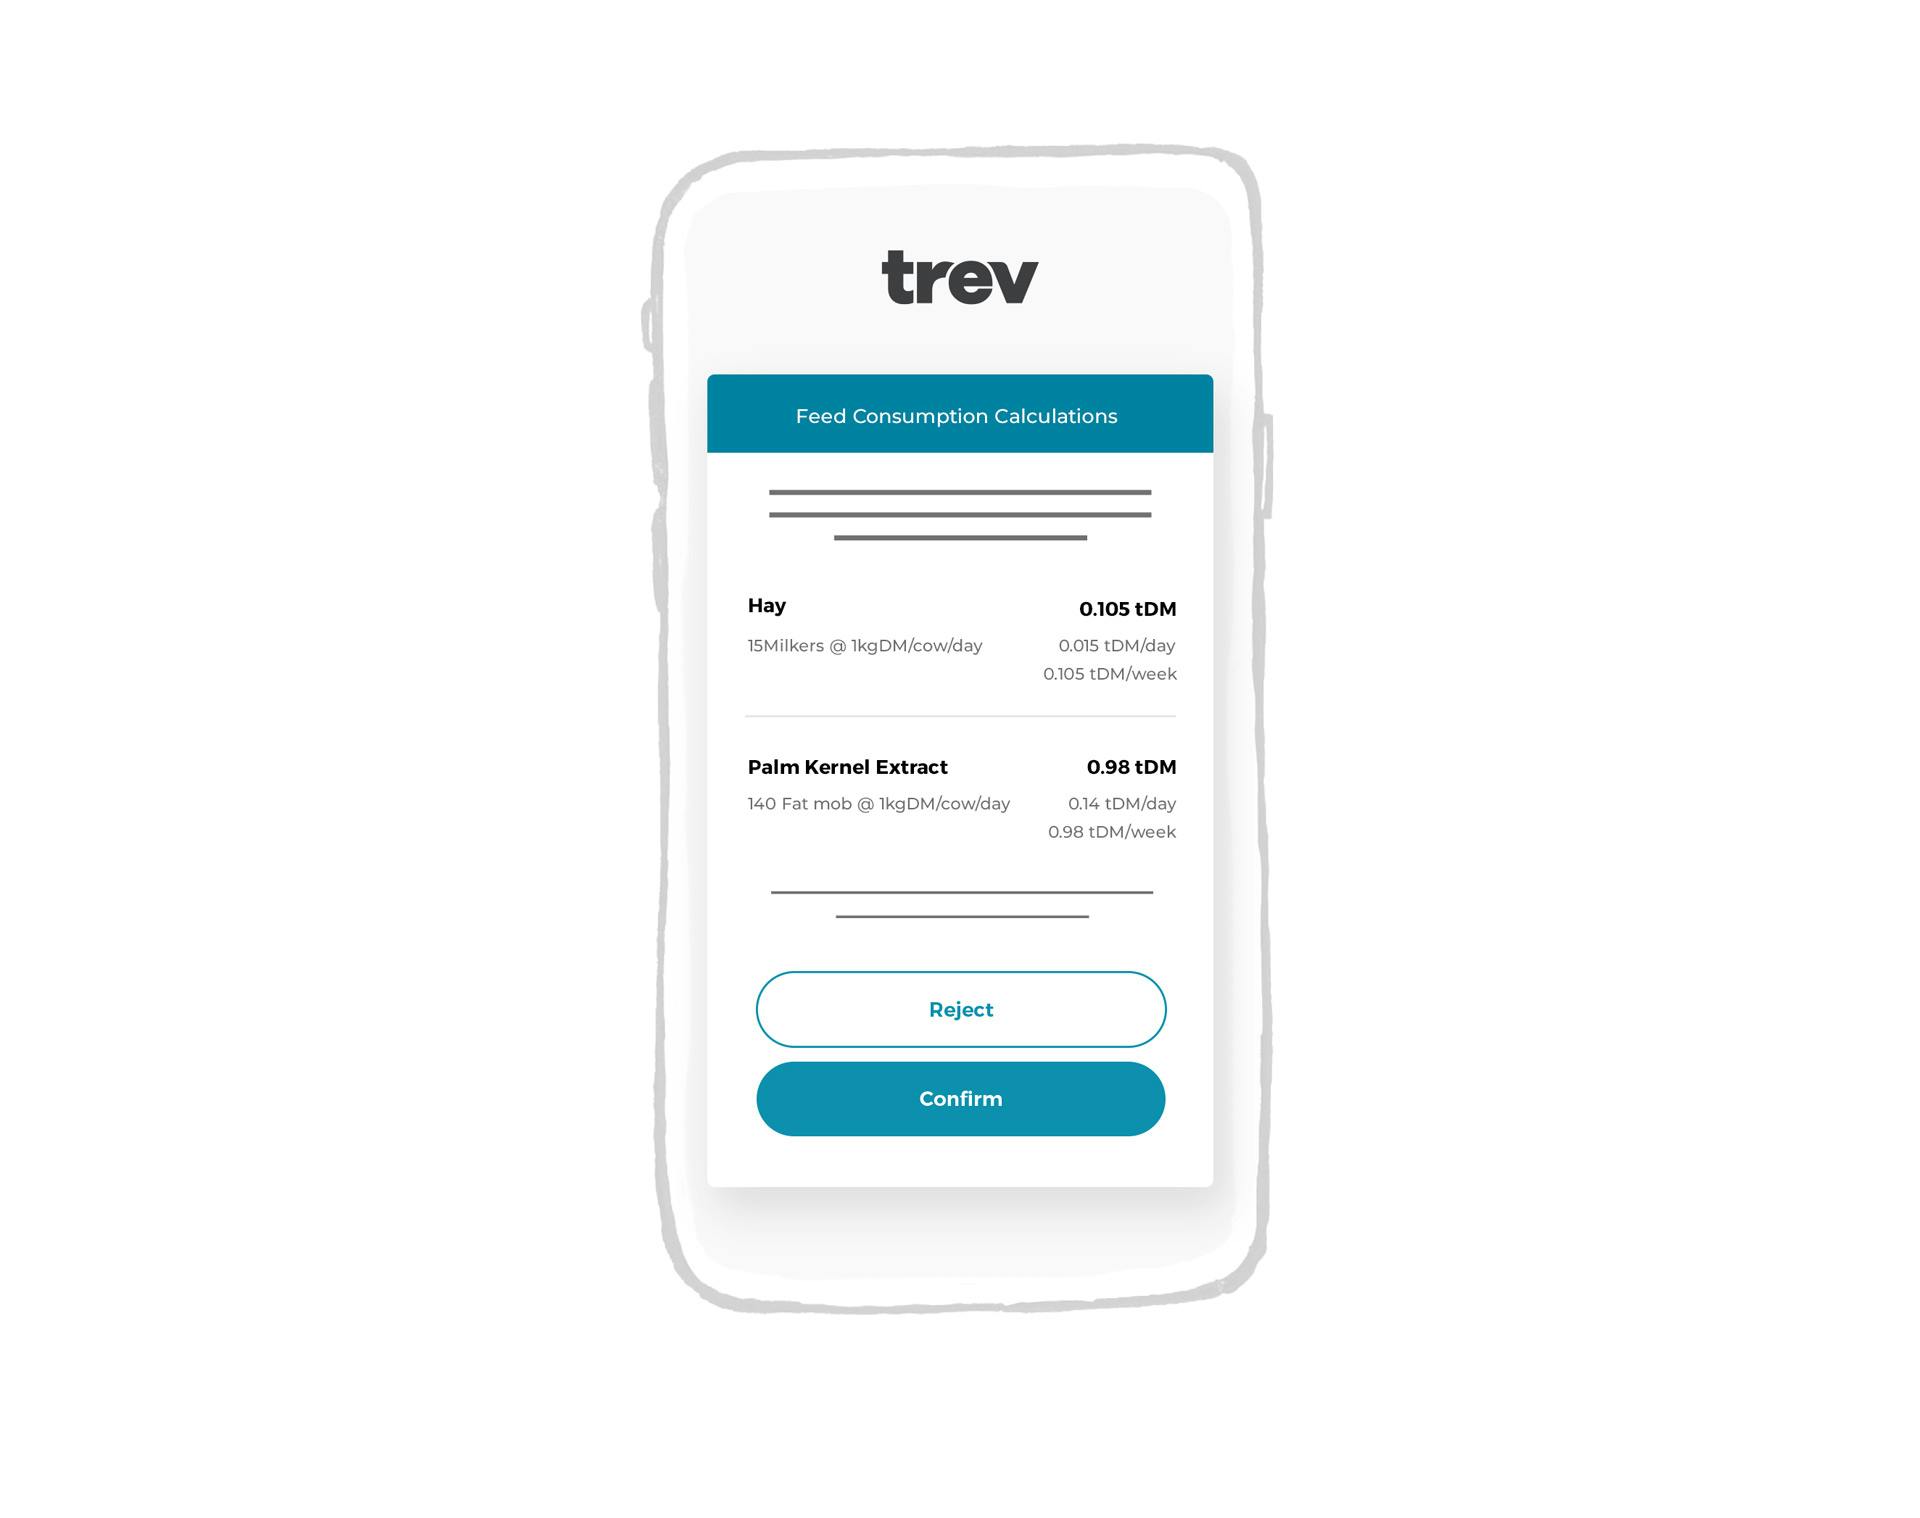
Straight talking.
Trev’s one for honesty and will check your numbers against each other for improved accuracy. Have confidence that your stock numbers add up in your per cow production and feed rec calculations. Any reports you pull to assess farm performance will be easy to view, easy to understand and given to you straight.
Get it on the go.
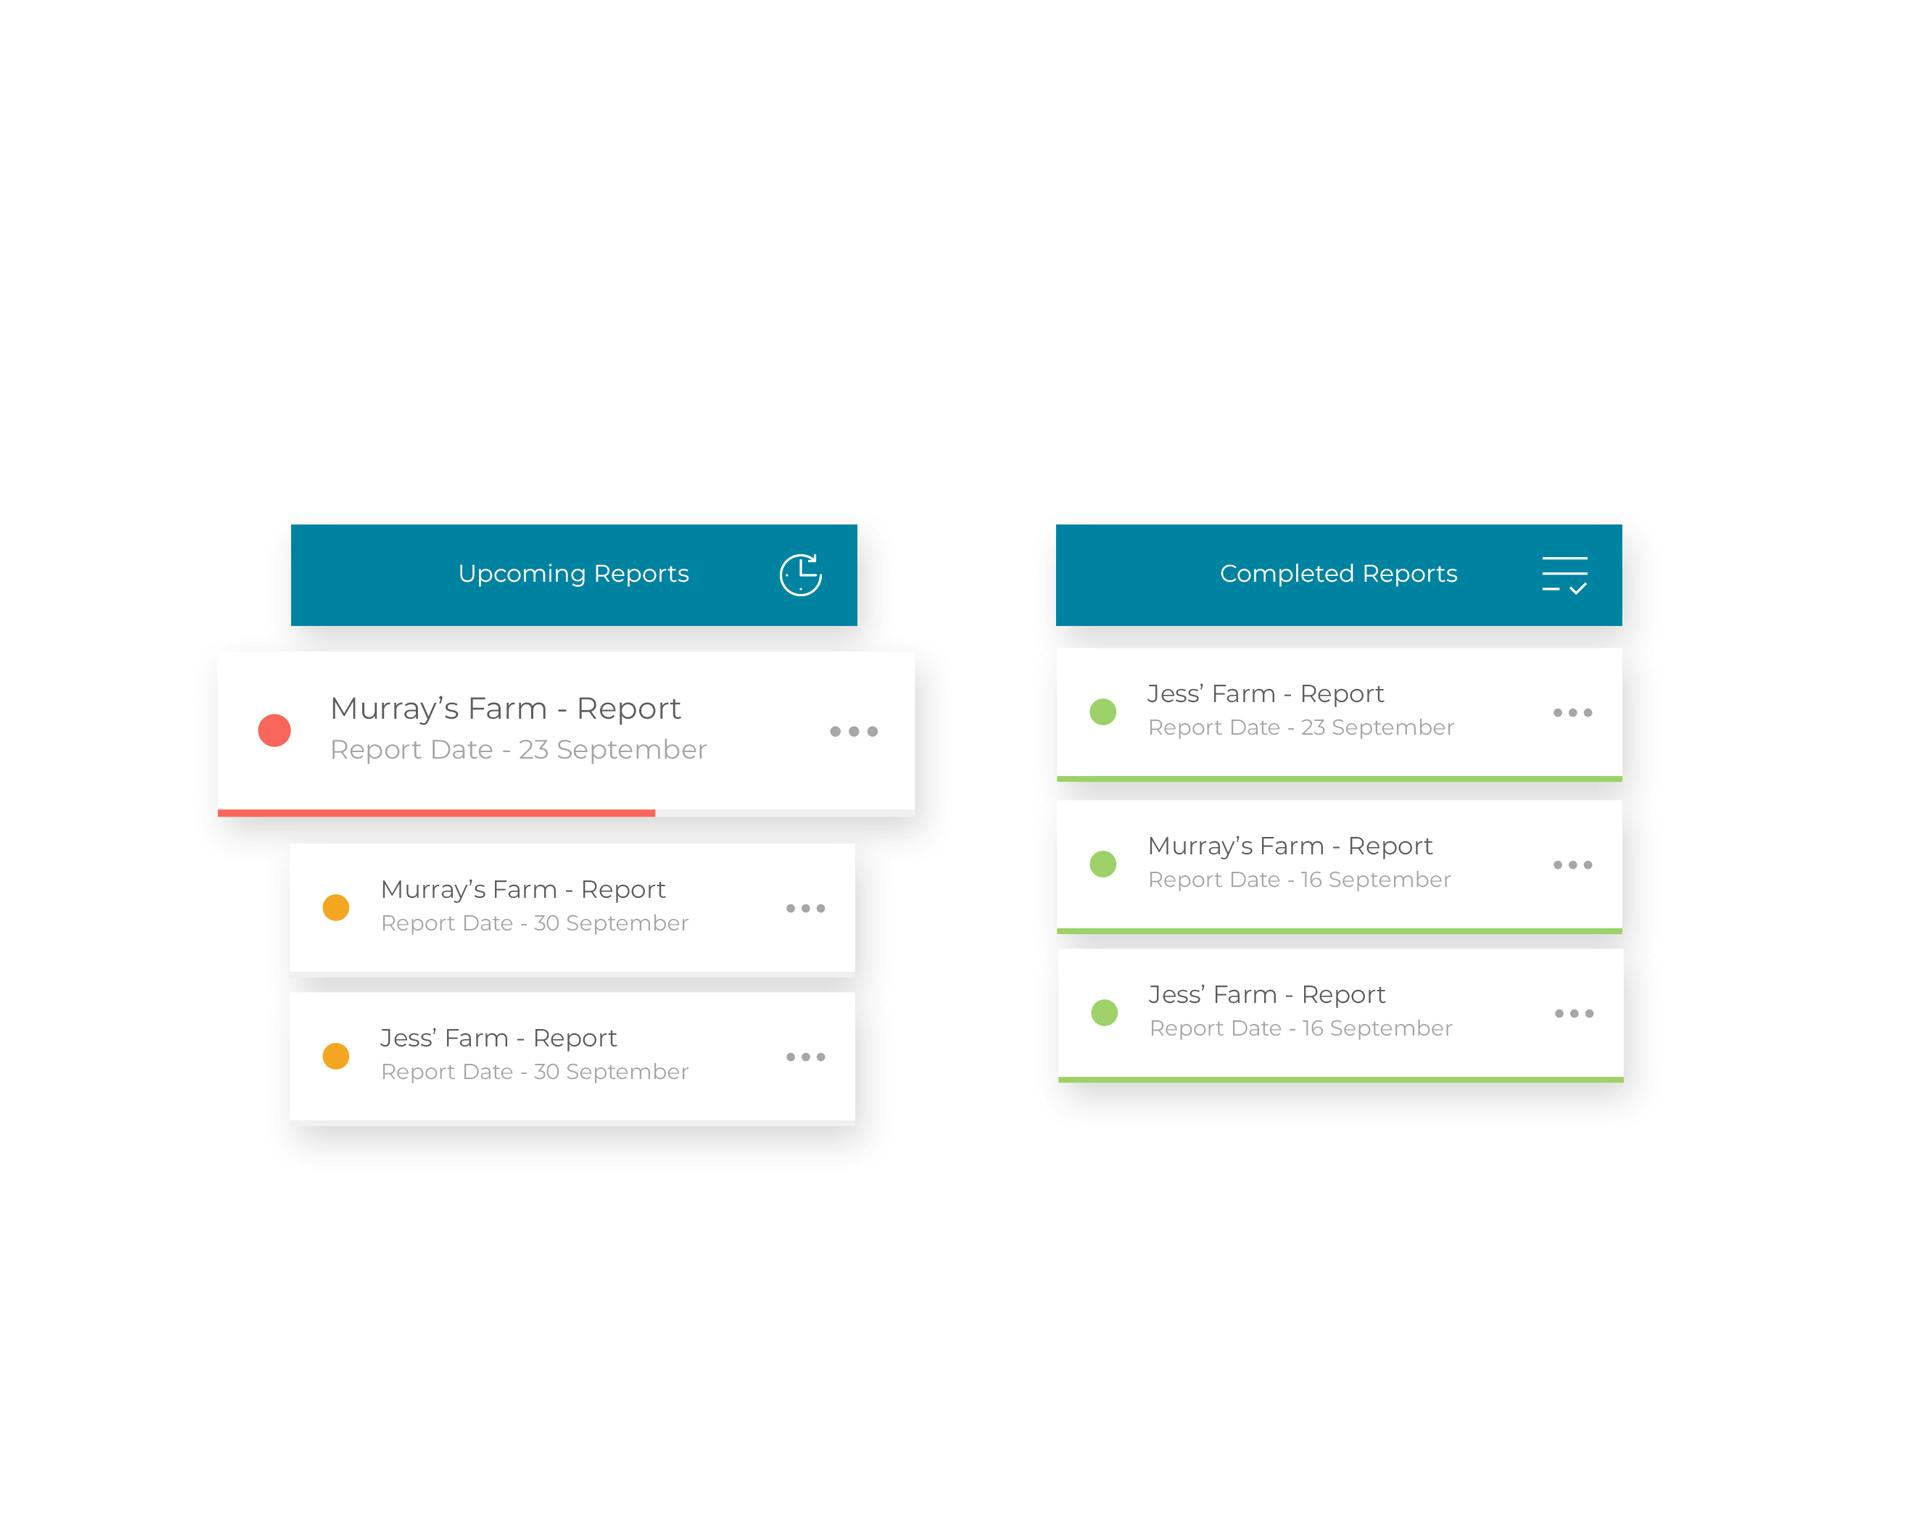
Your farming data is always changing so we’ve built Trev to keep up. With an internet connection and your favourite browser, you’ll have instant access to livestock and feed events as soon as a report is completed by your on-farm reporter. Get a picture of per cow production using actual in-vat cow numbers as the denominator or know how much feed is on-hand at any time, without being on-farm.
Find your features.
Instant aggregation.
Inter-farm benchmarking.
