Product
Get to know Trev from top to bottom
Trev’s demo environment is designed to give you an overview of how the reporting and analytics sections of the platform work. We’ve set up a handful of dummy farms which means you’ll be able to explore everything from single farm to multifarm reports during the demo. All data is fictitious so feel free to get in, edit and put Trev to the test.
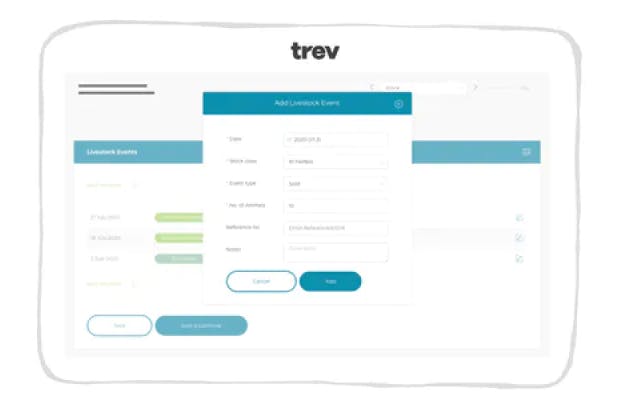
Weekly Reporting Process
We recommend giving the Trev weekly reporting process a crack. This gives a feel for the breadth of data that Trev collates and demonstrates just how easy reports are to complete. Capture data on stock, feed, fertiliser, R&M, environment, and compliance. Farm reporting is a piece of cake when it takes less than 10 minutes a week!
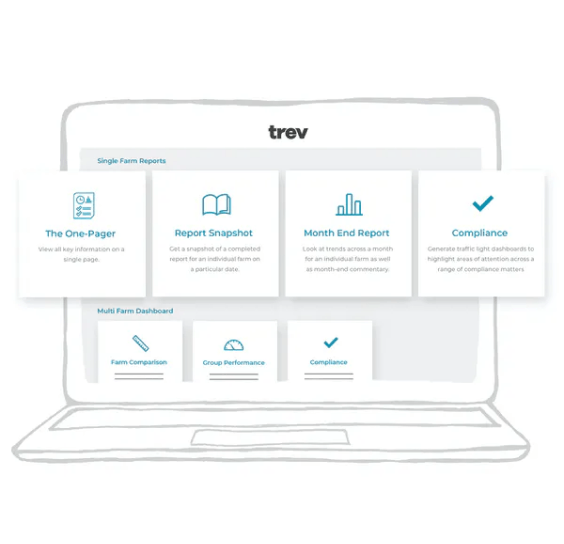
Analytics Dashboards & Reports
In Trev's analytics section it’s also worth checking out the Farm Comparison dashboard - probably our most popular report. To find this click the menu icon in the top left corner to navigate to Analytics. Here you’ll see all the different reports we offer, start with this one and then take a gander at the rest.
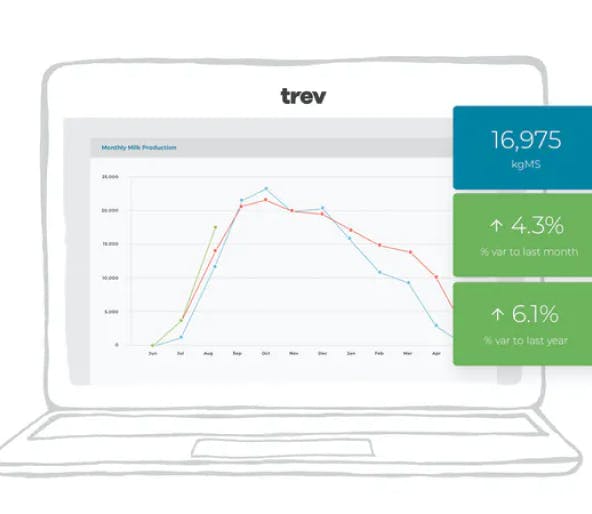
Single-farm report
If you’re wanting to drill into the specifics for a single farm then check out the Month End report, or for a short and sharp run down of the current situation on a particular farm go for the (very creatively named) One Pager report.
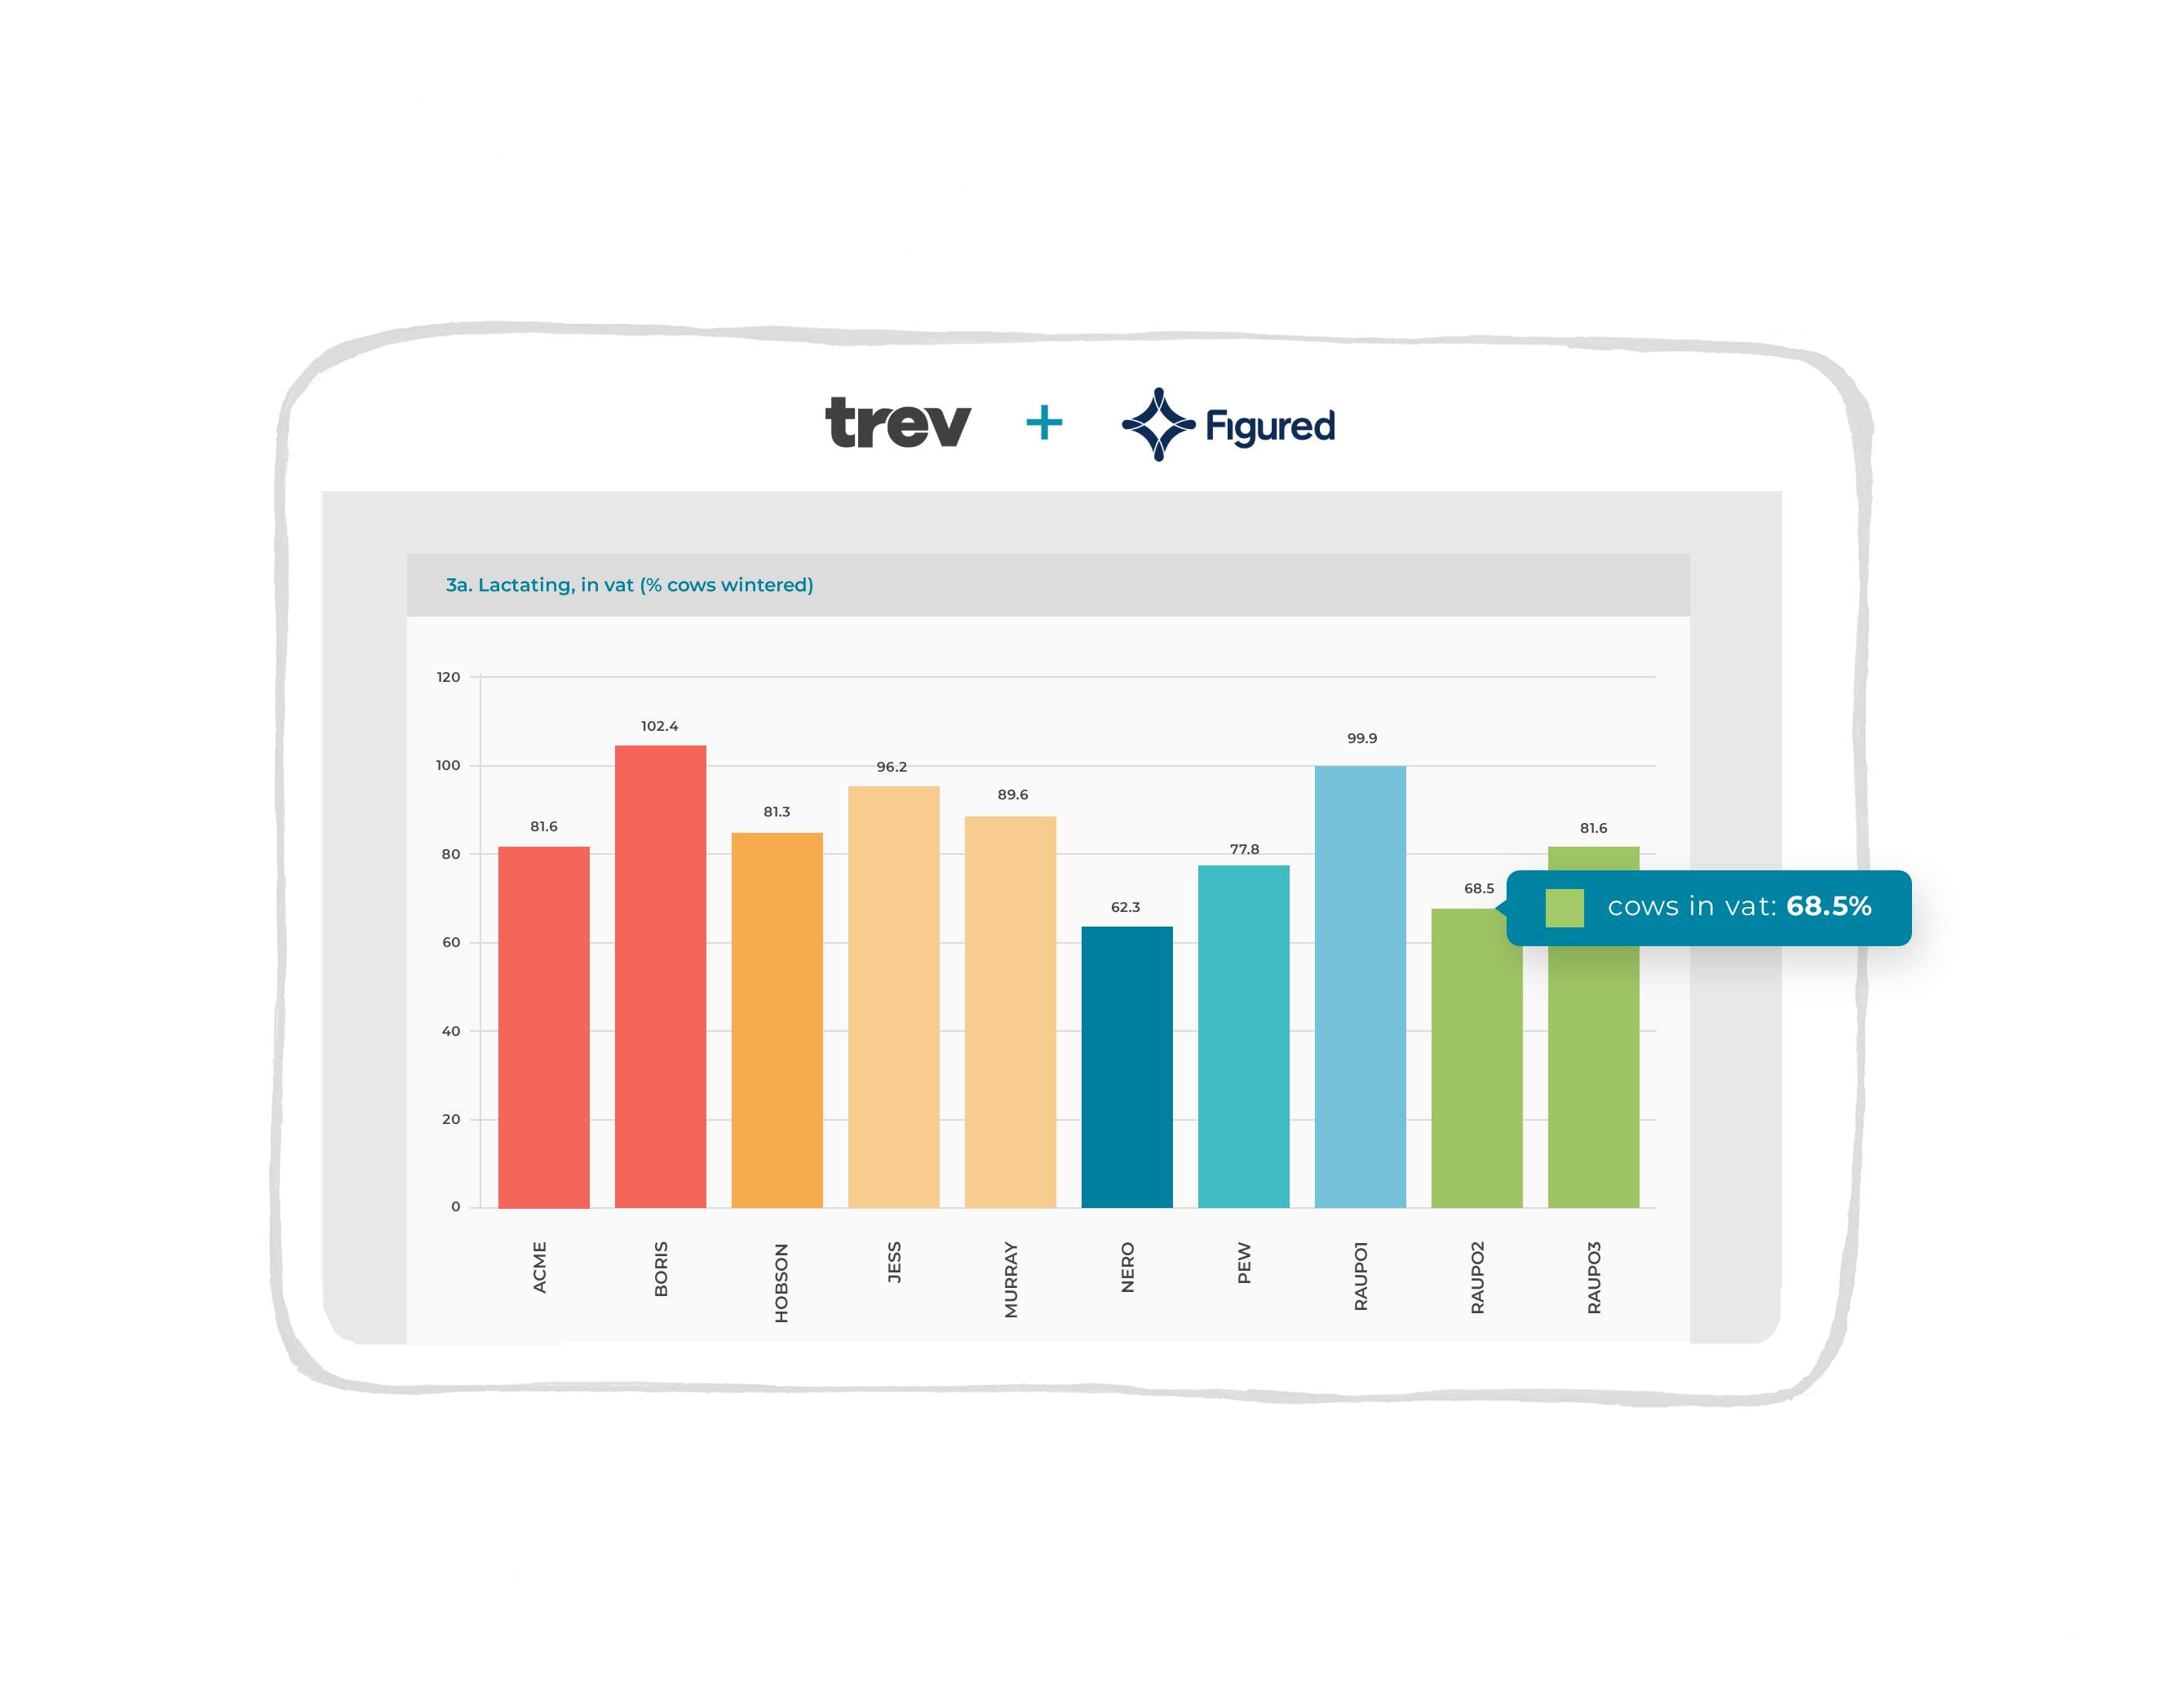
Multi-farm reports
Want to view multiple farms in a single glance and quickly identify outliers that need your attention? Try out Trev’s benchmarking capabilities using the Farm Comparison dashboard. Or need to see how multiple farms are operating at hub, group or client company level? Use the Group Performance report to build up aggregated metrics in a flash.
Detailed reports
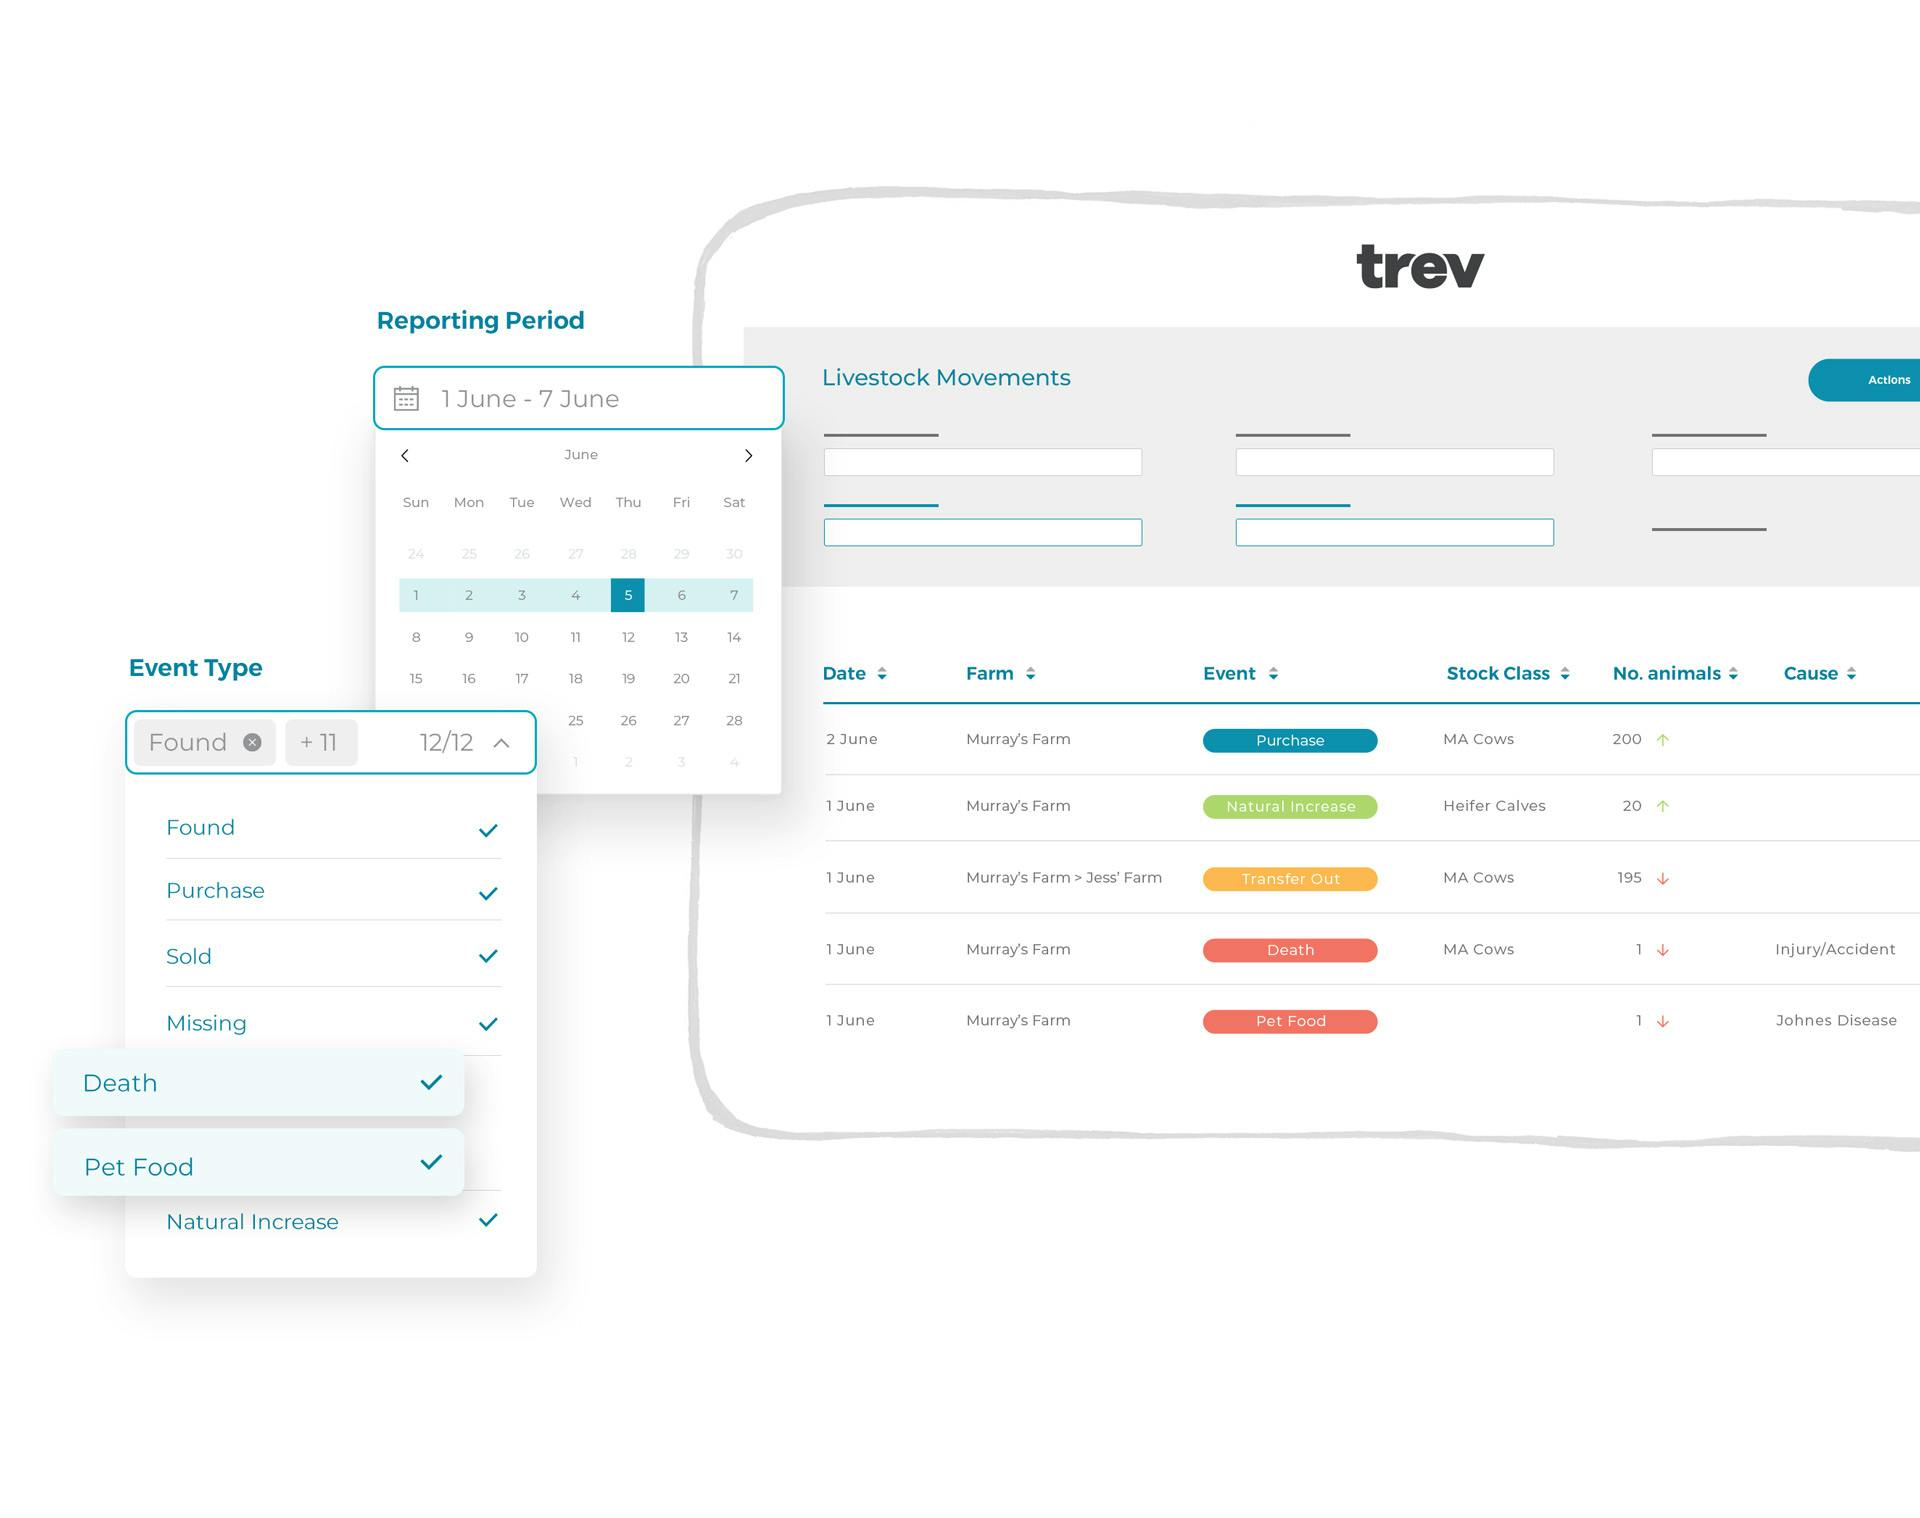
This is where you can get down to the nuts and bolts of the underlying data to eyeball and export. Use Trev’s filtering system to quickly ring fence selected farms, dates and event types and build livestock and feed reconciliations in a matter of clicks.