Trev’s full of features to help your data earn its keep.
Farm systems can be complicated but your farm reporting doesn’t need to be.
Get Trev in your toolbox.
Trev pulls your operational data into one place, giving you a clear view of what’s happening on farm and where your team needs to focus.

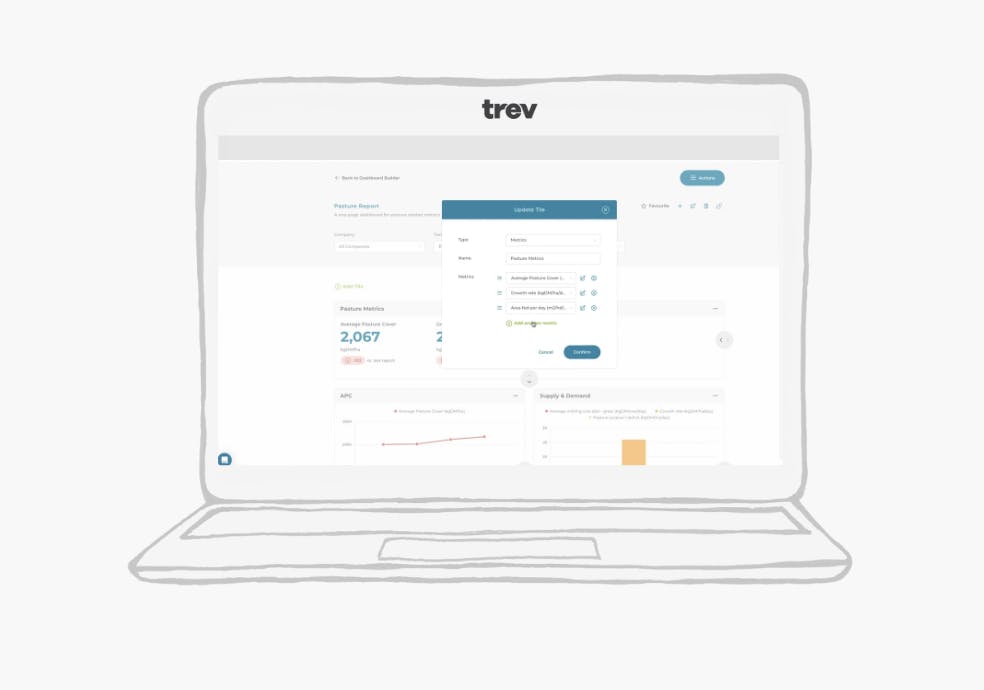
Build.
Say goodbye to spreadsheets. Build your own database of operational farm information.
Data Collection Tool
Build your database on a platform that's easy to use and specifically designed for farmers.
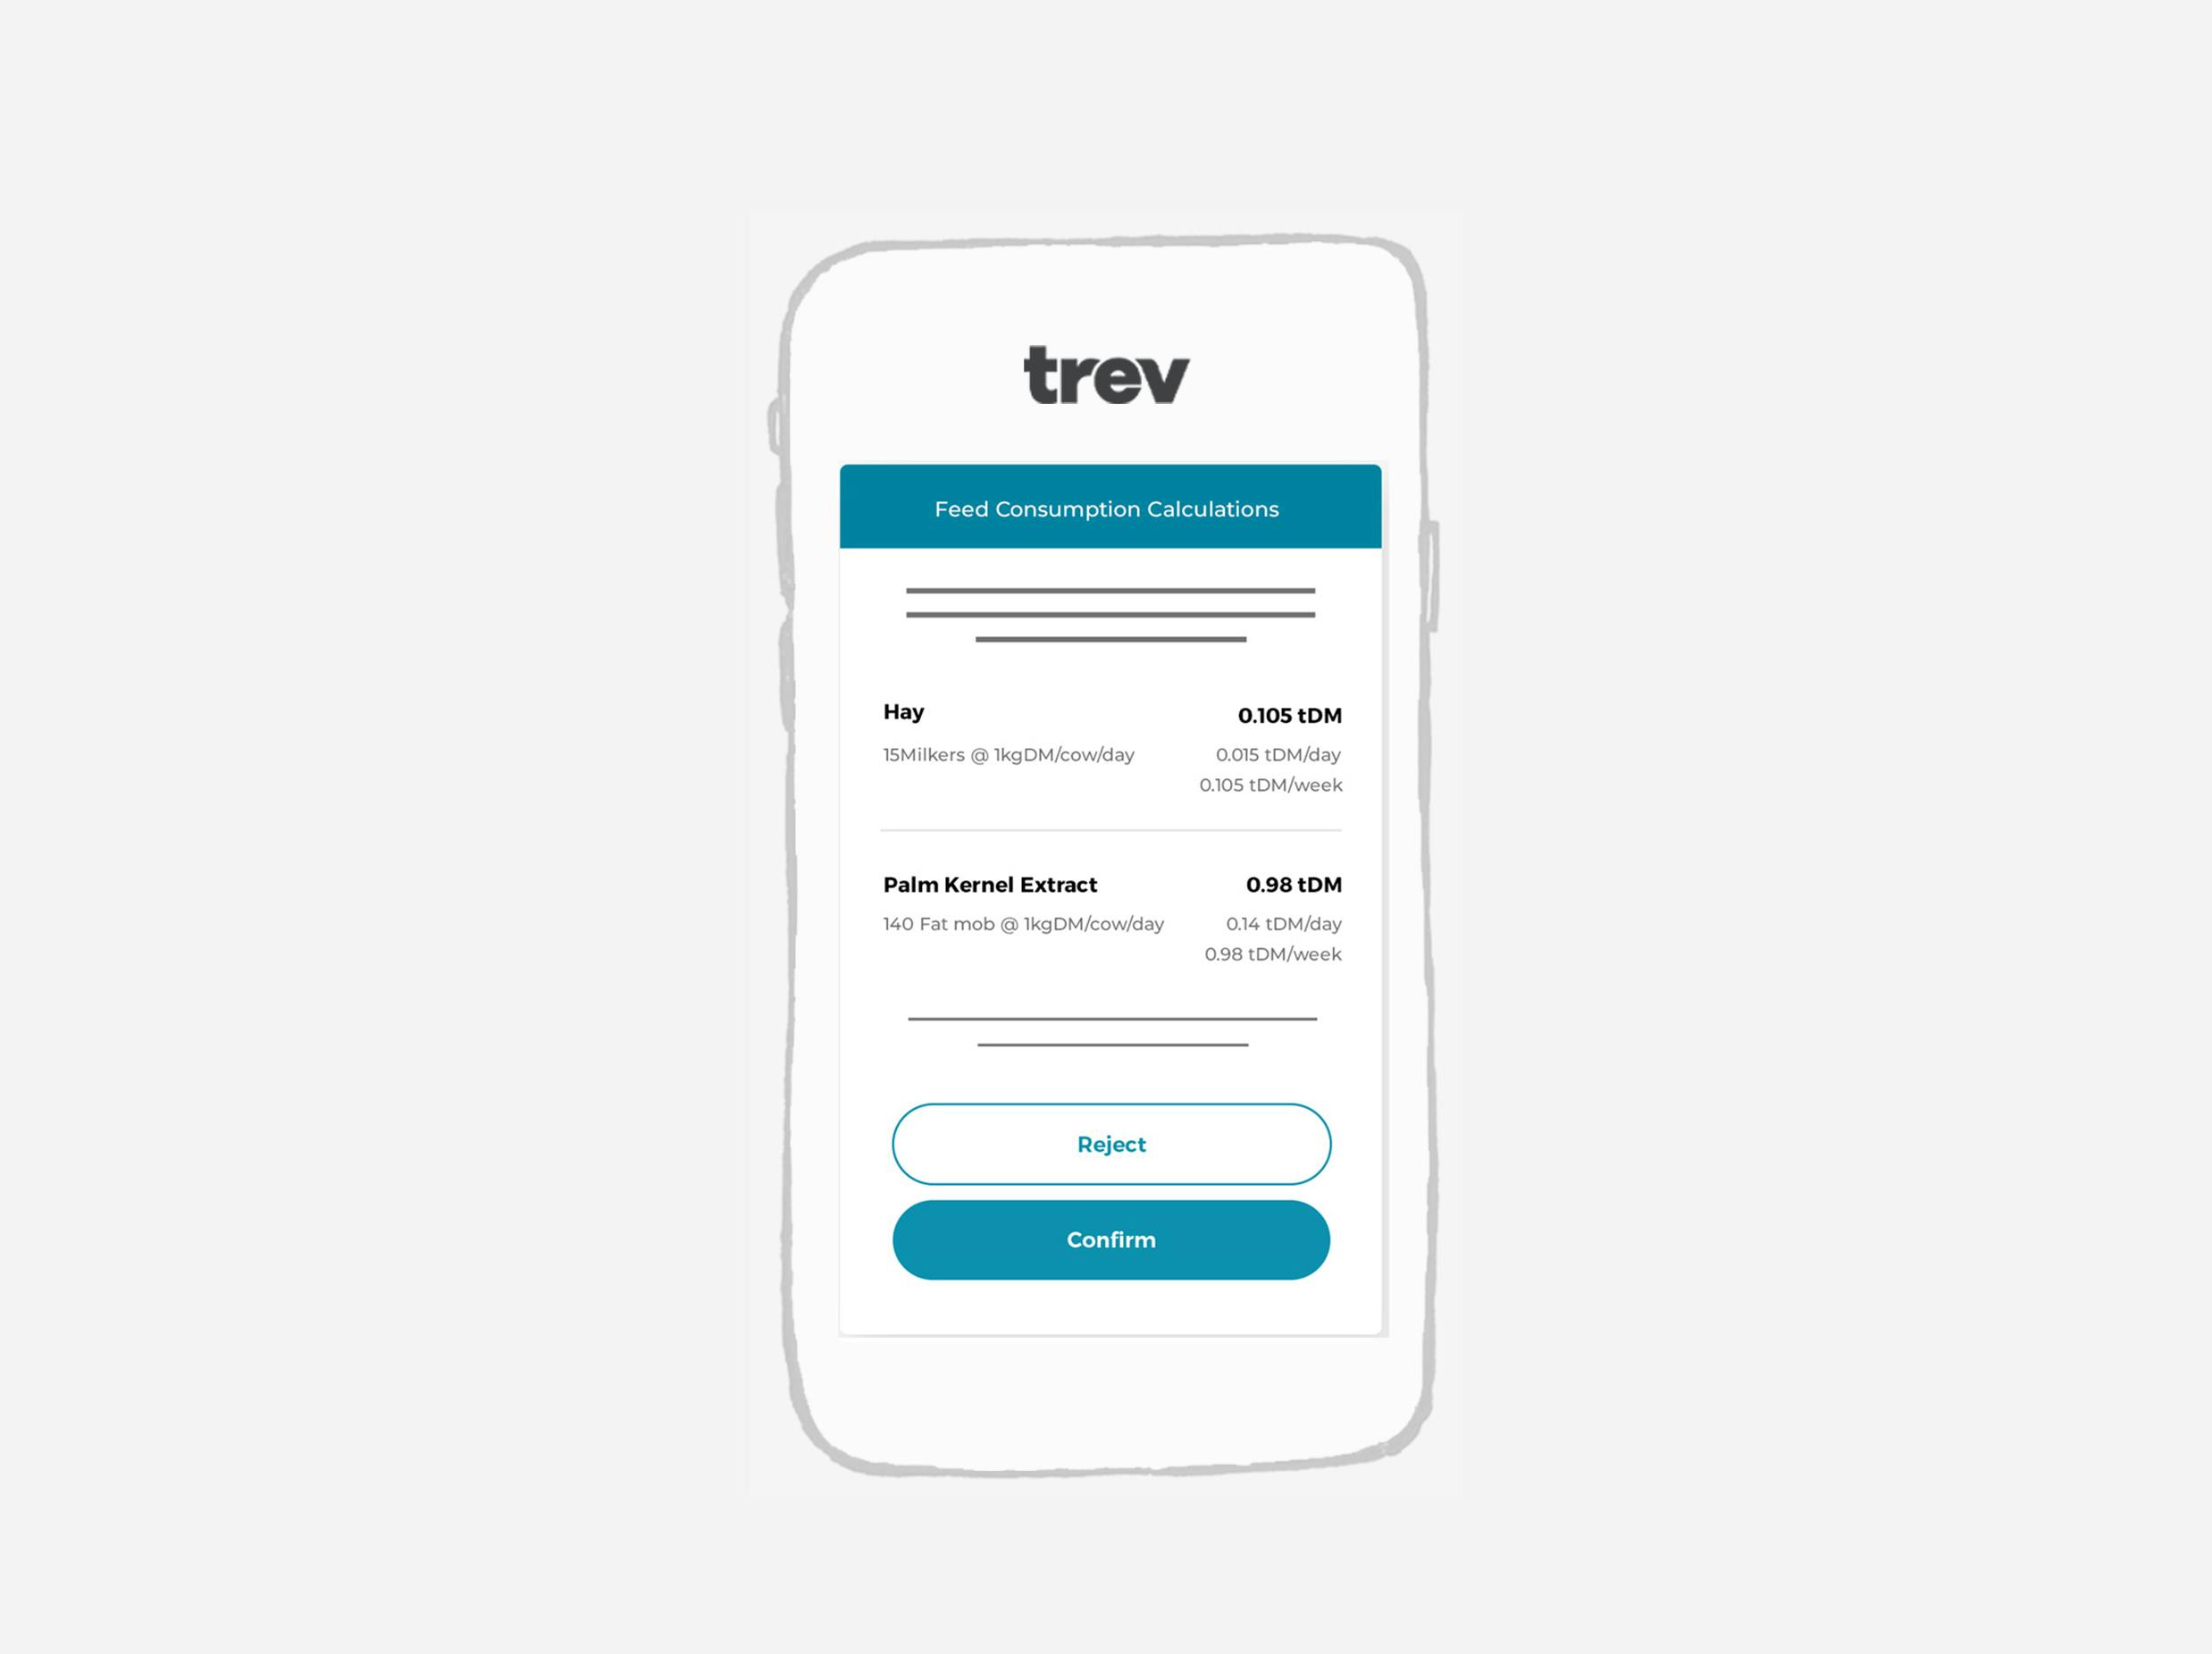
Completing Reports
Complete your weekly farm reporting process in less than 10 minutes per week.
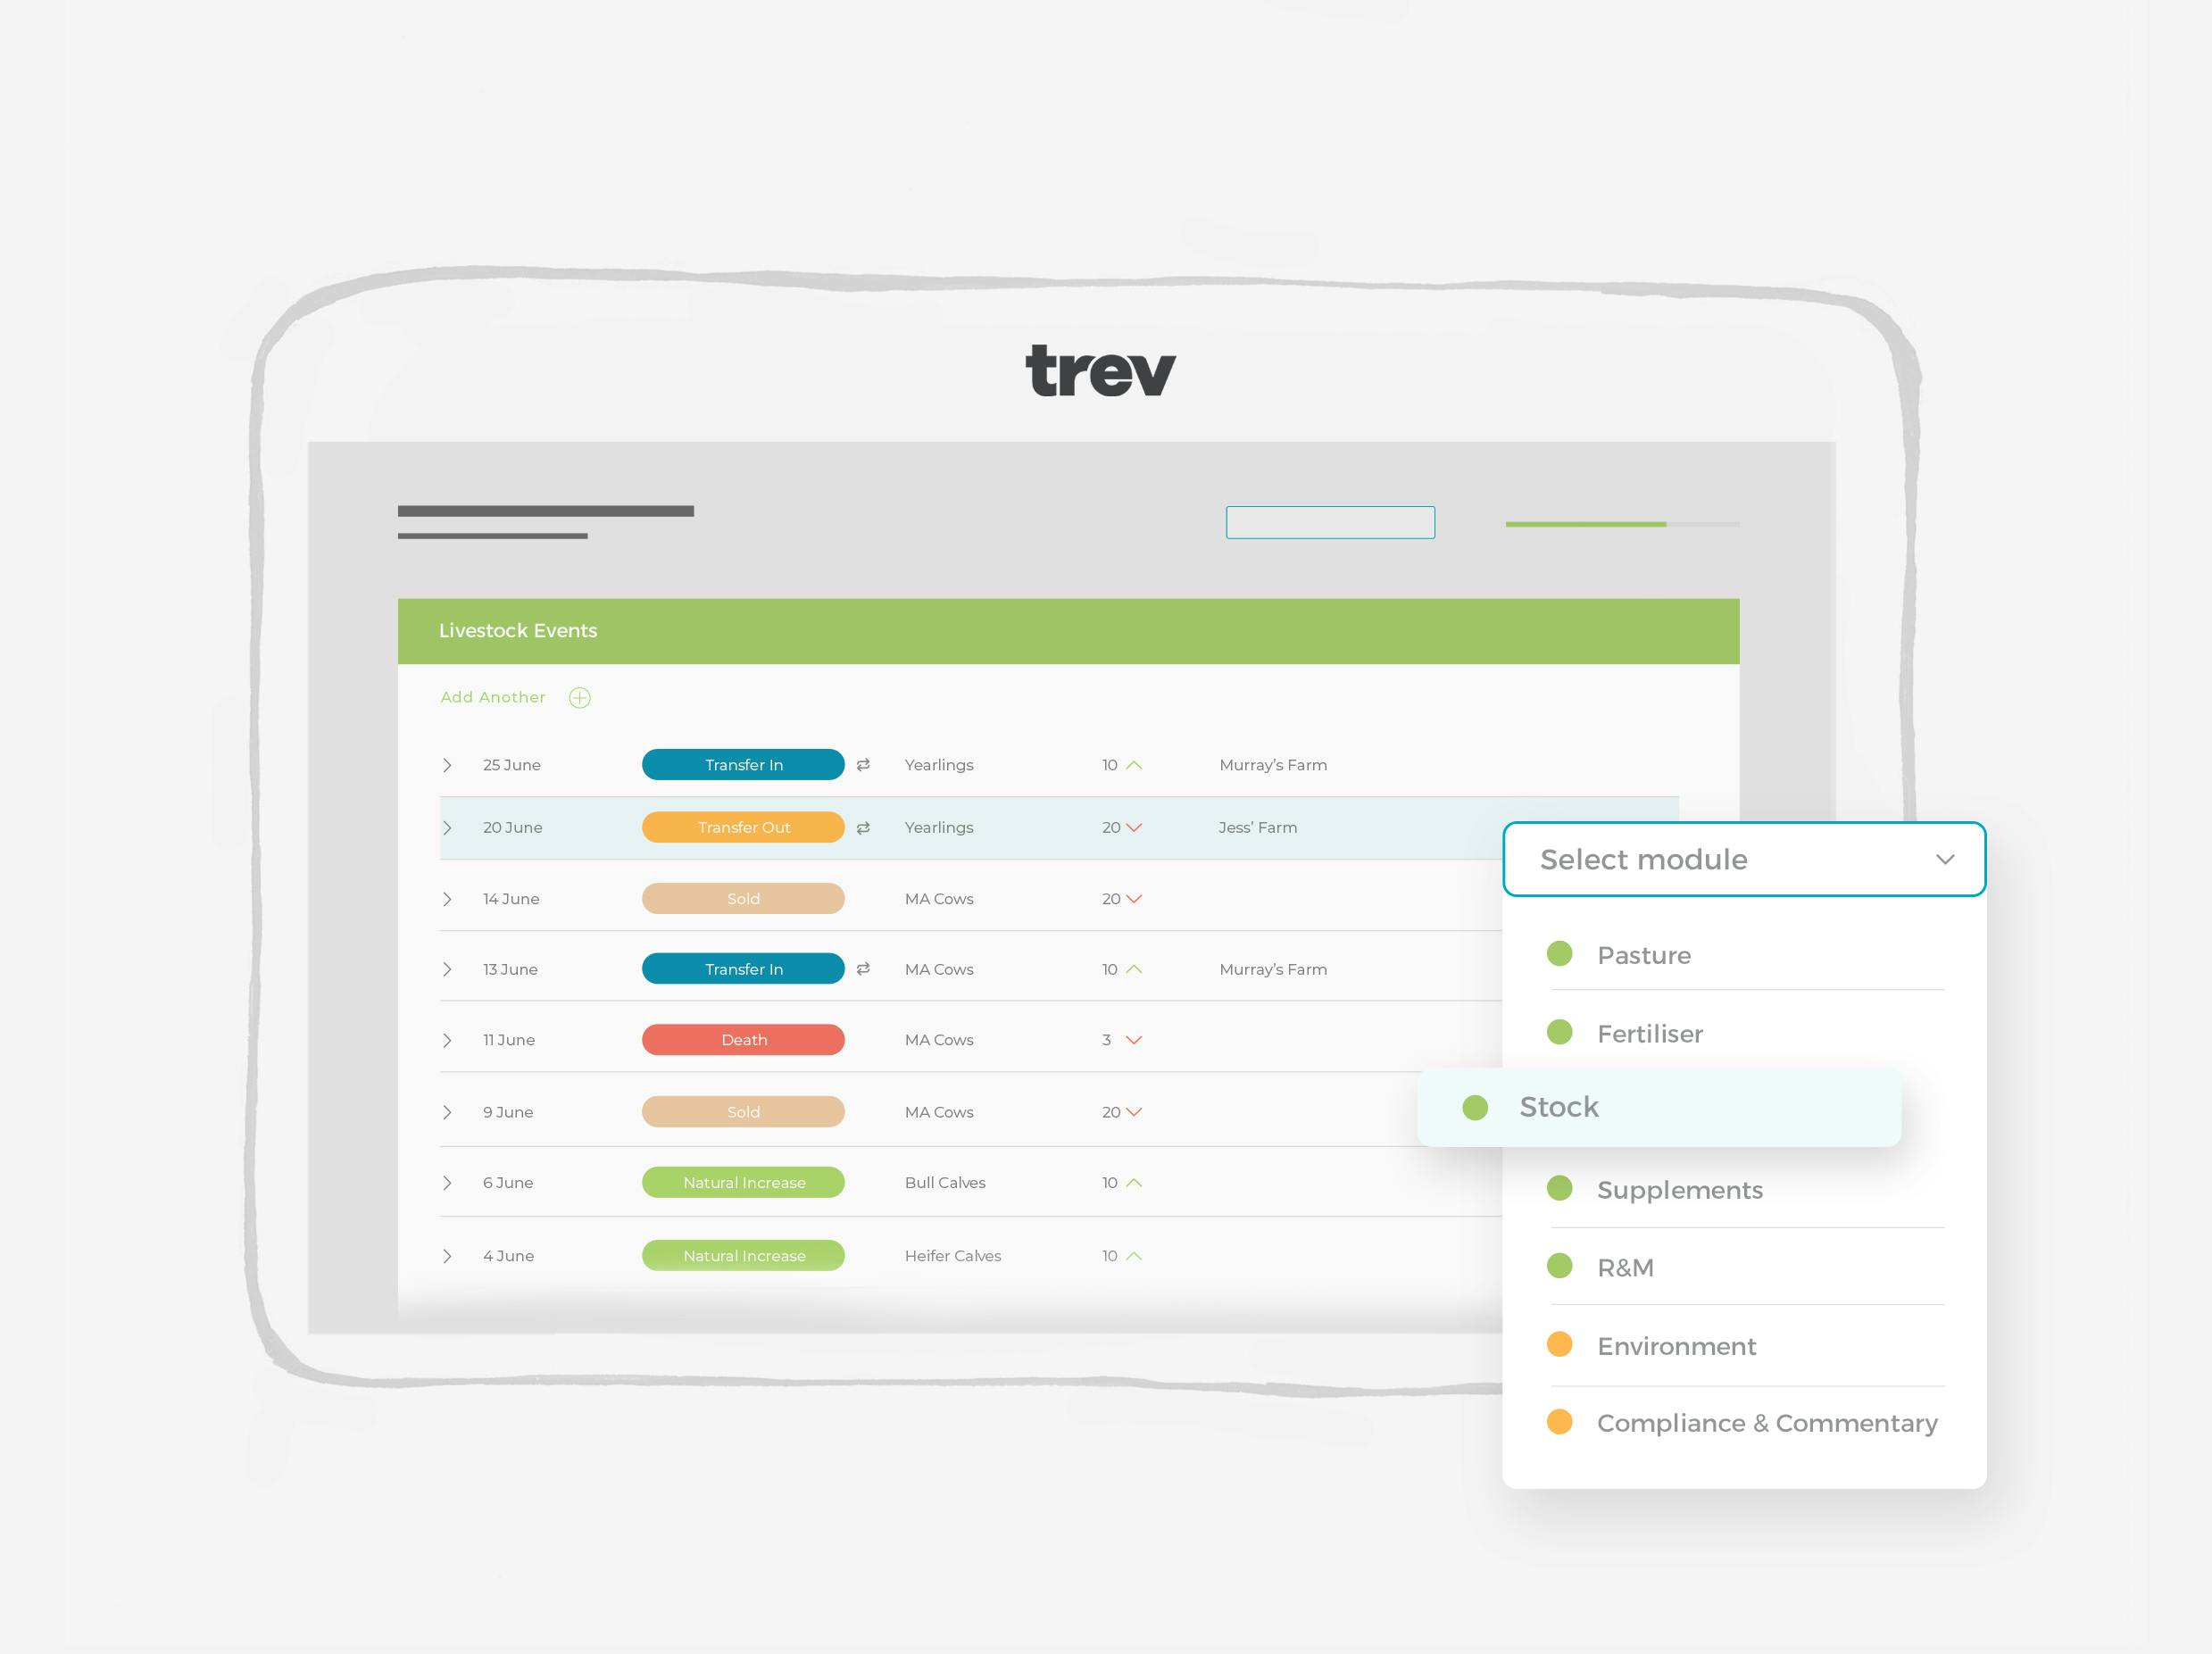
Customisable Modules
Pick the modules that work for your farm. Pasture, Supplements, Livestock, Fertiliser, R&M, Environment, Compliance and more.
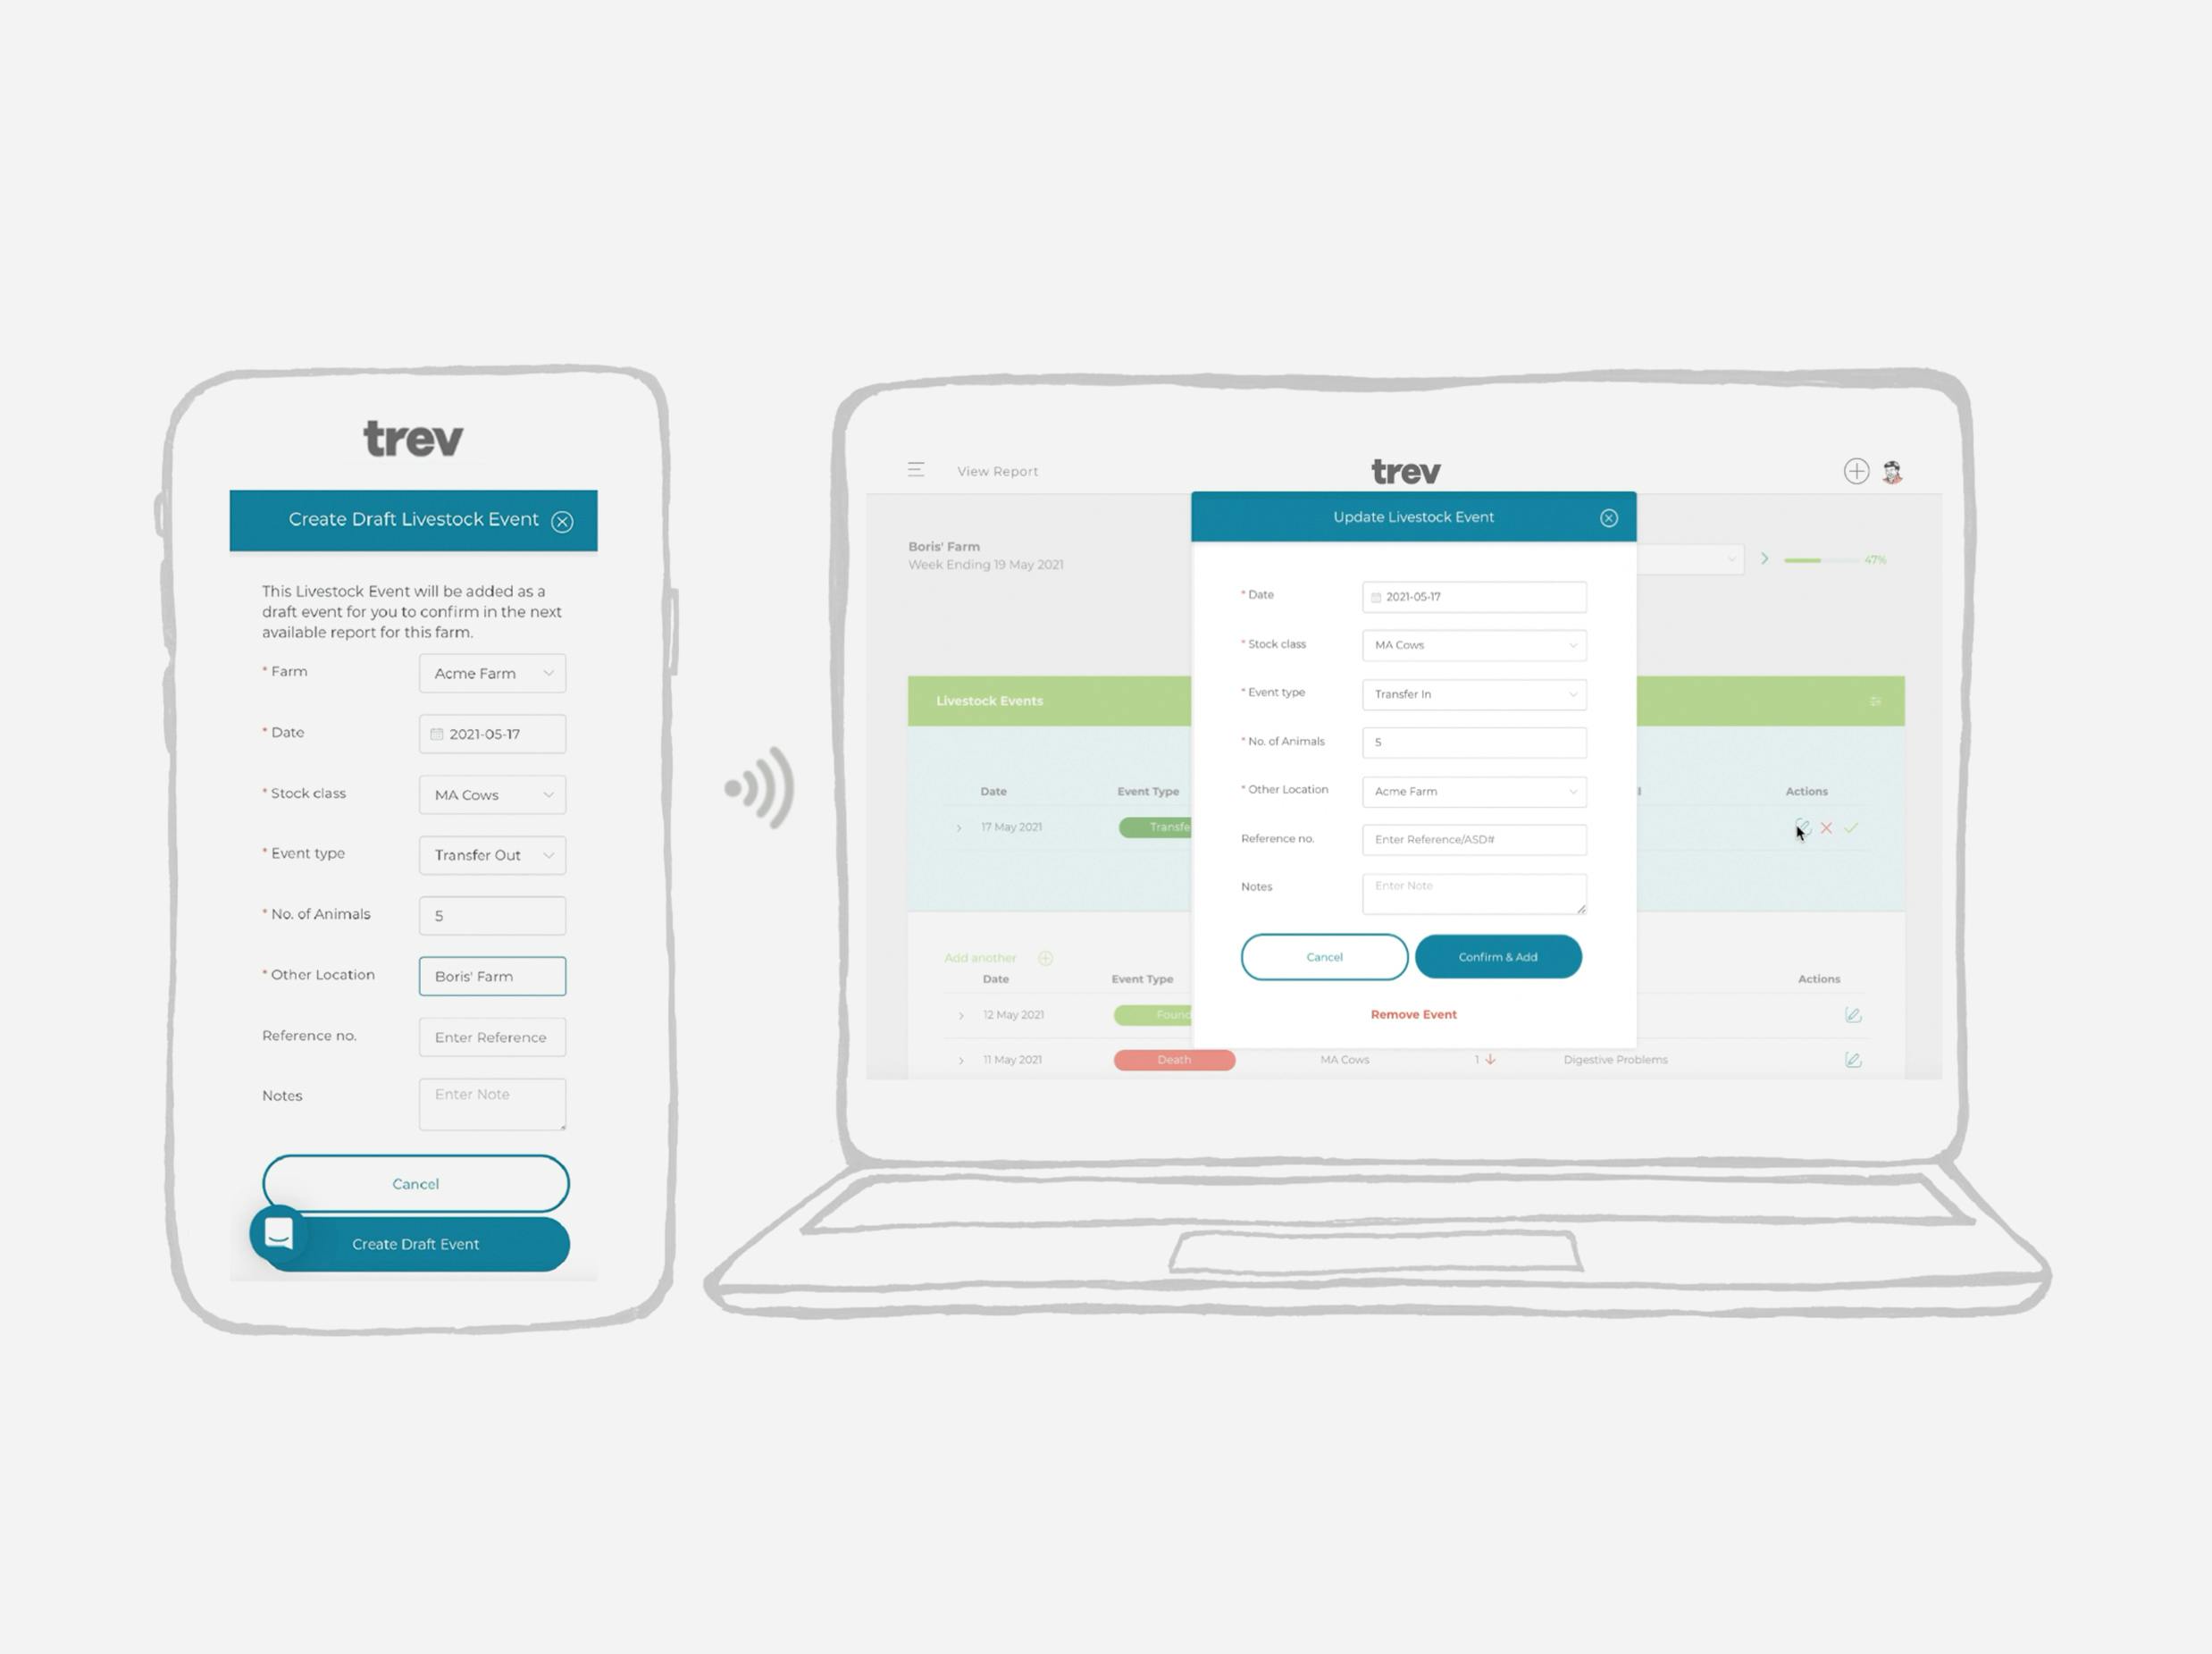
Inter-farm Transfers
Maintain accurate records with automated transfers between farms.
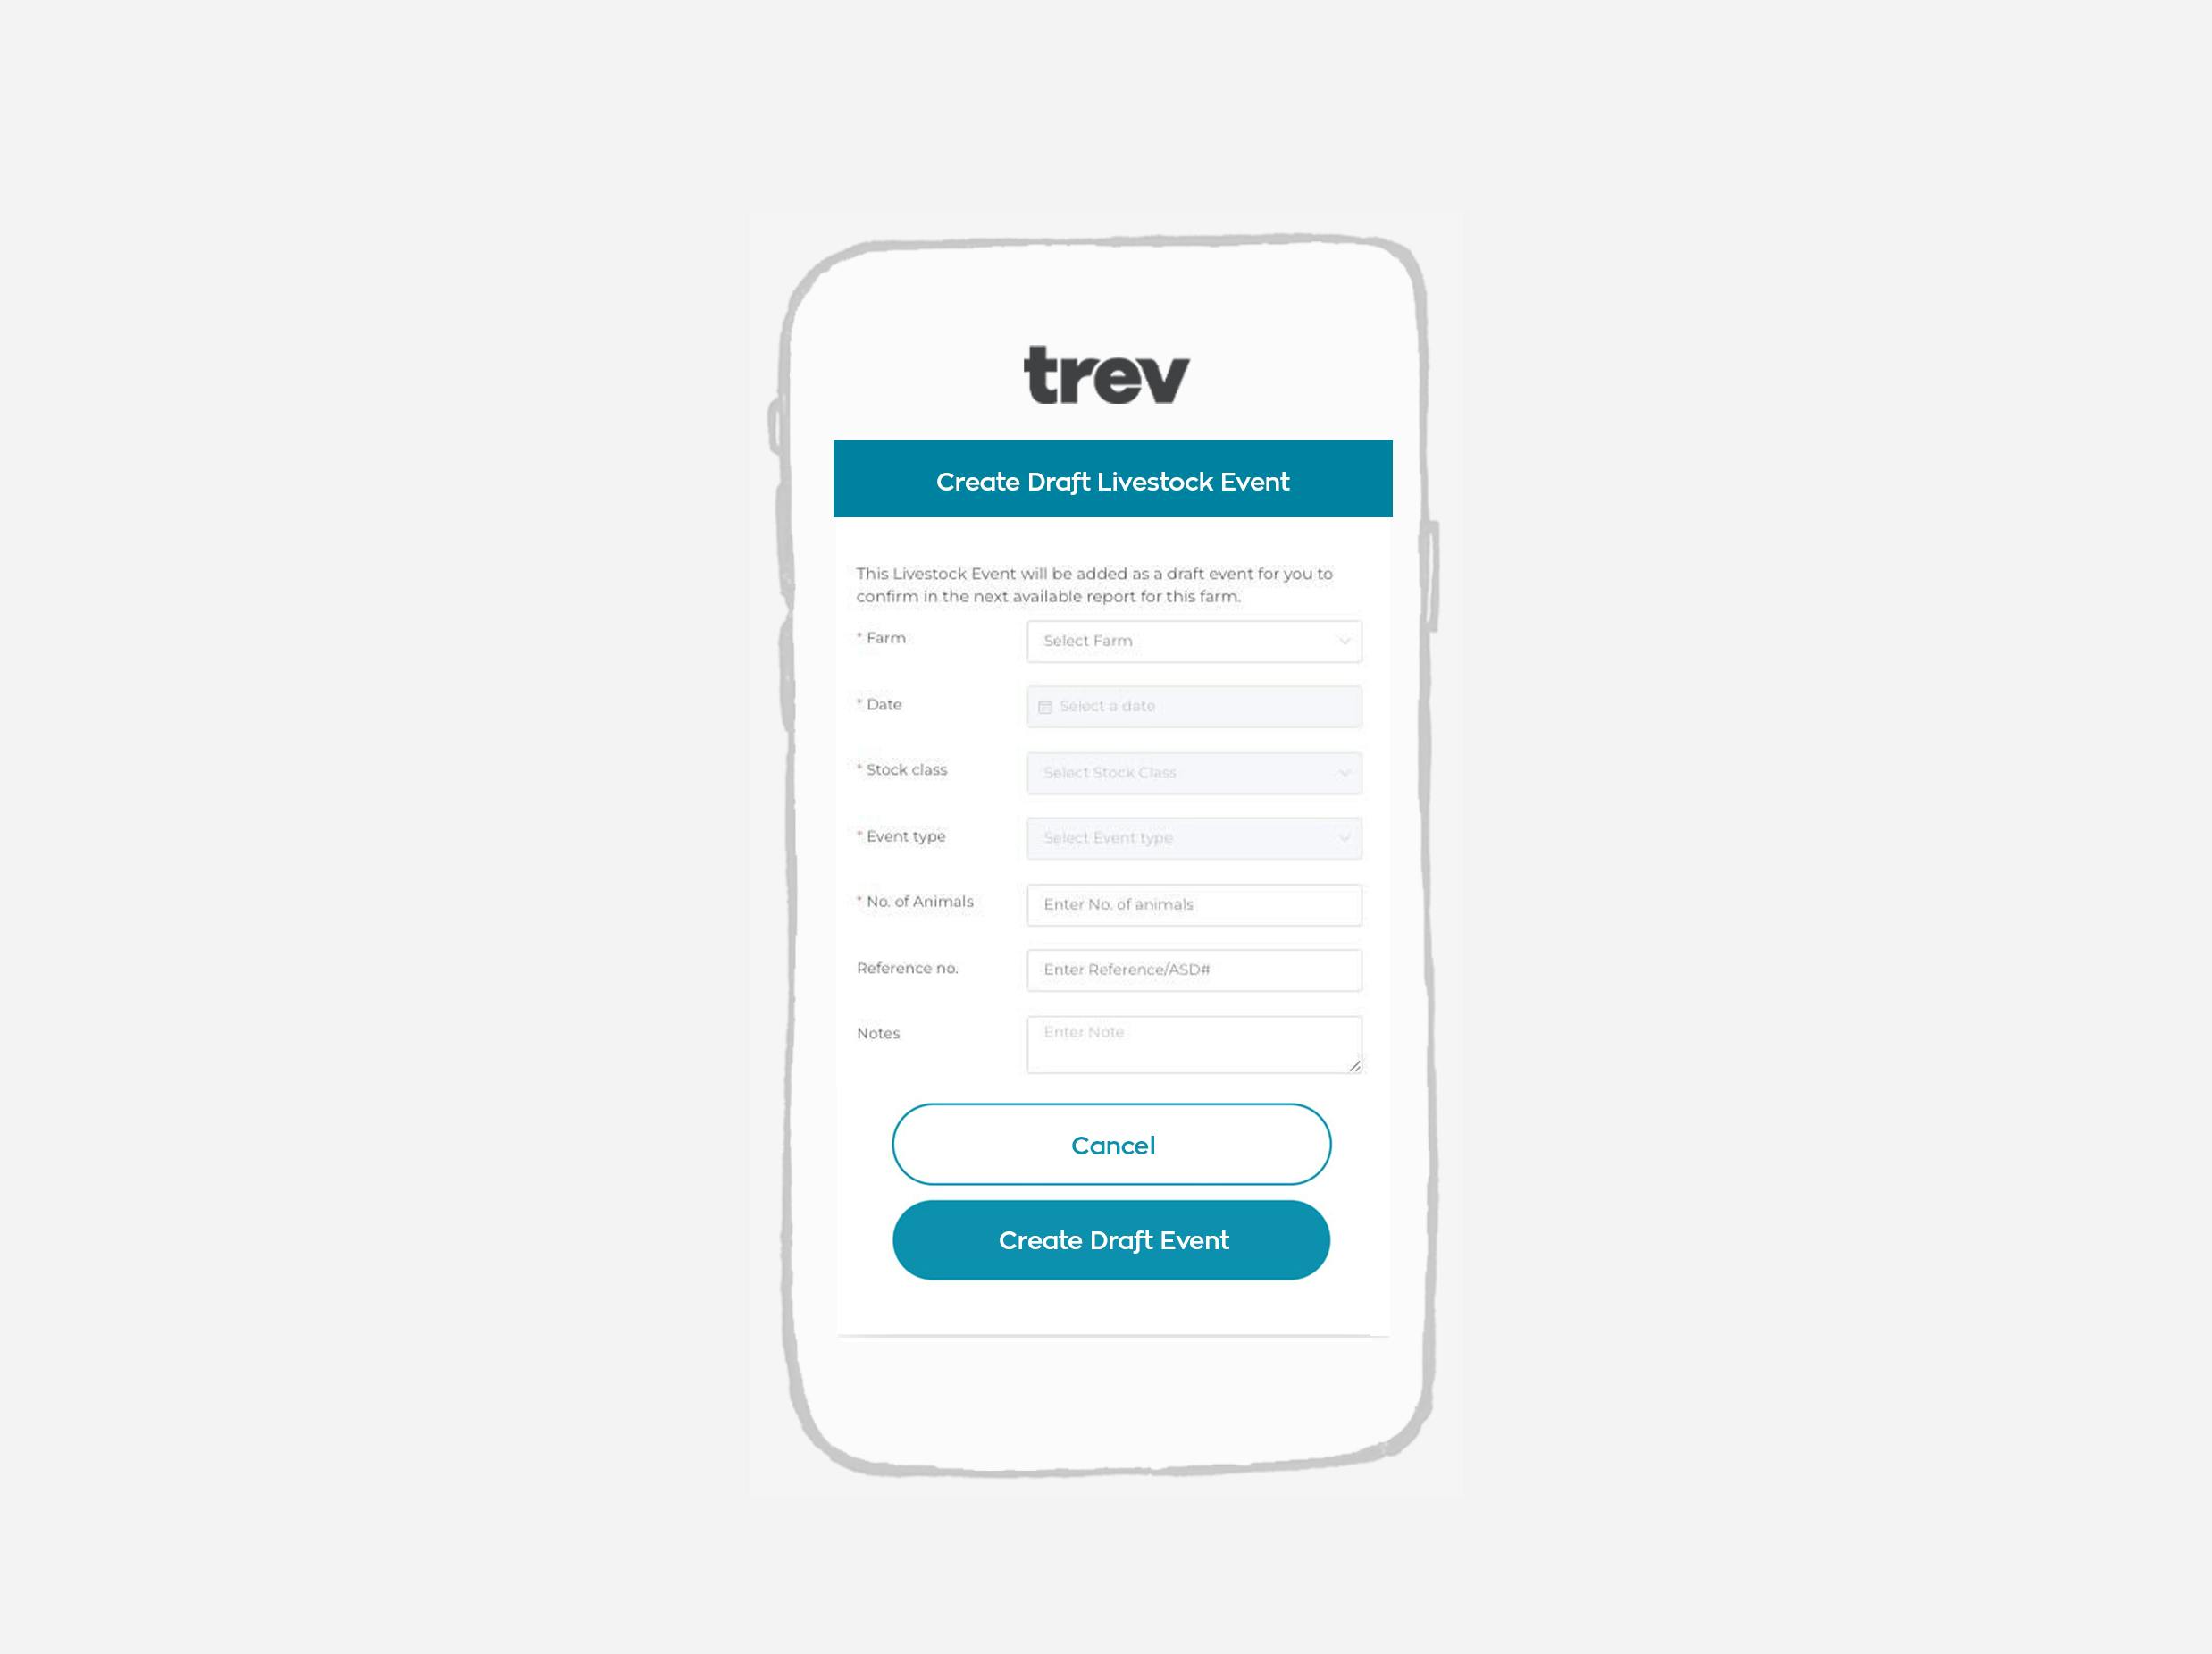
Quick Add
Want to build details on the fly?

Pair.
Your data on its own is great but it's even more powerful when given context. Pair your farm with industry partners to gain another level of insight.
Data Integrations
Seamlessly pair your farm with industry data to gain another level of insight.
Aggregrate Across Farms
Spend less time wrangling your data and more time extracting value from it.

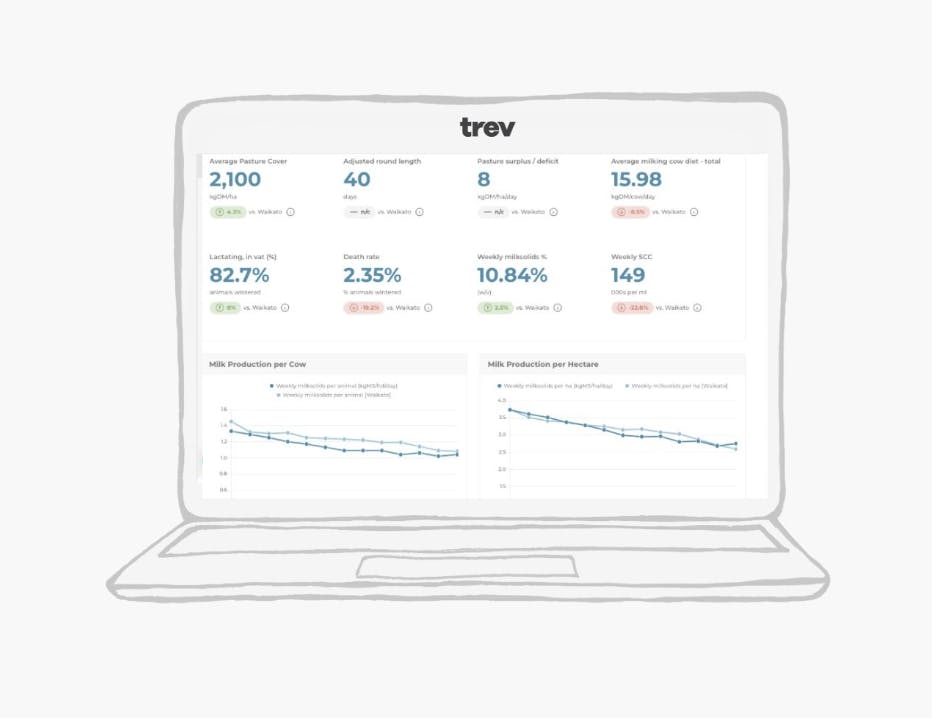
Analyse.
View your farm data in user-friendly dashboards and reports so you can monitor trends, stay across compliance, and make on-farm decisions.
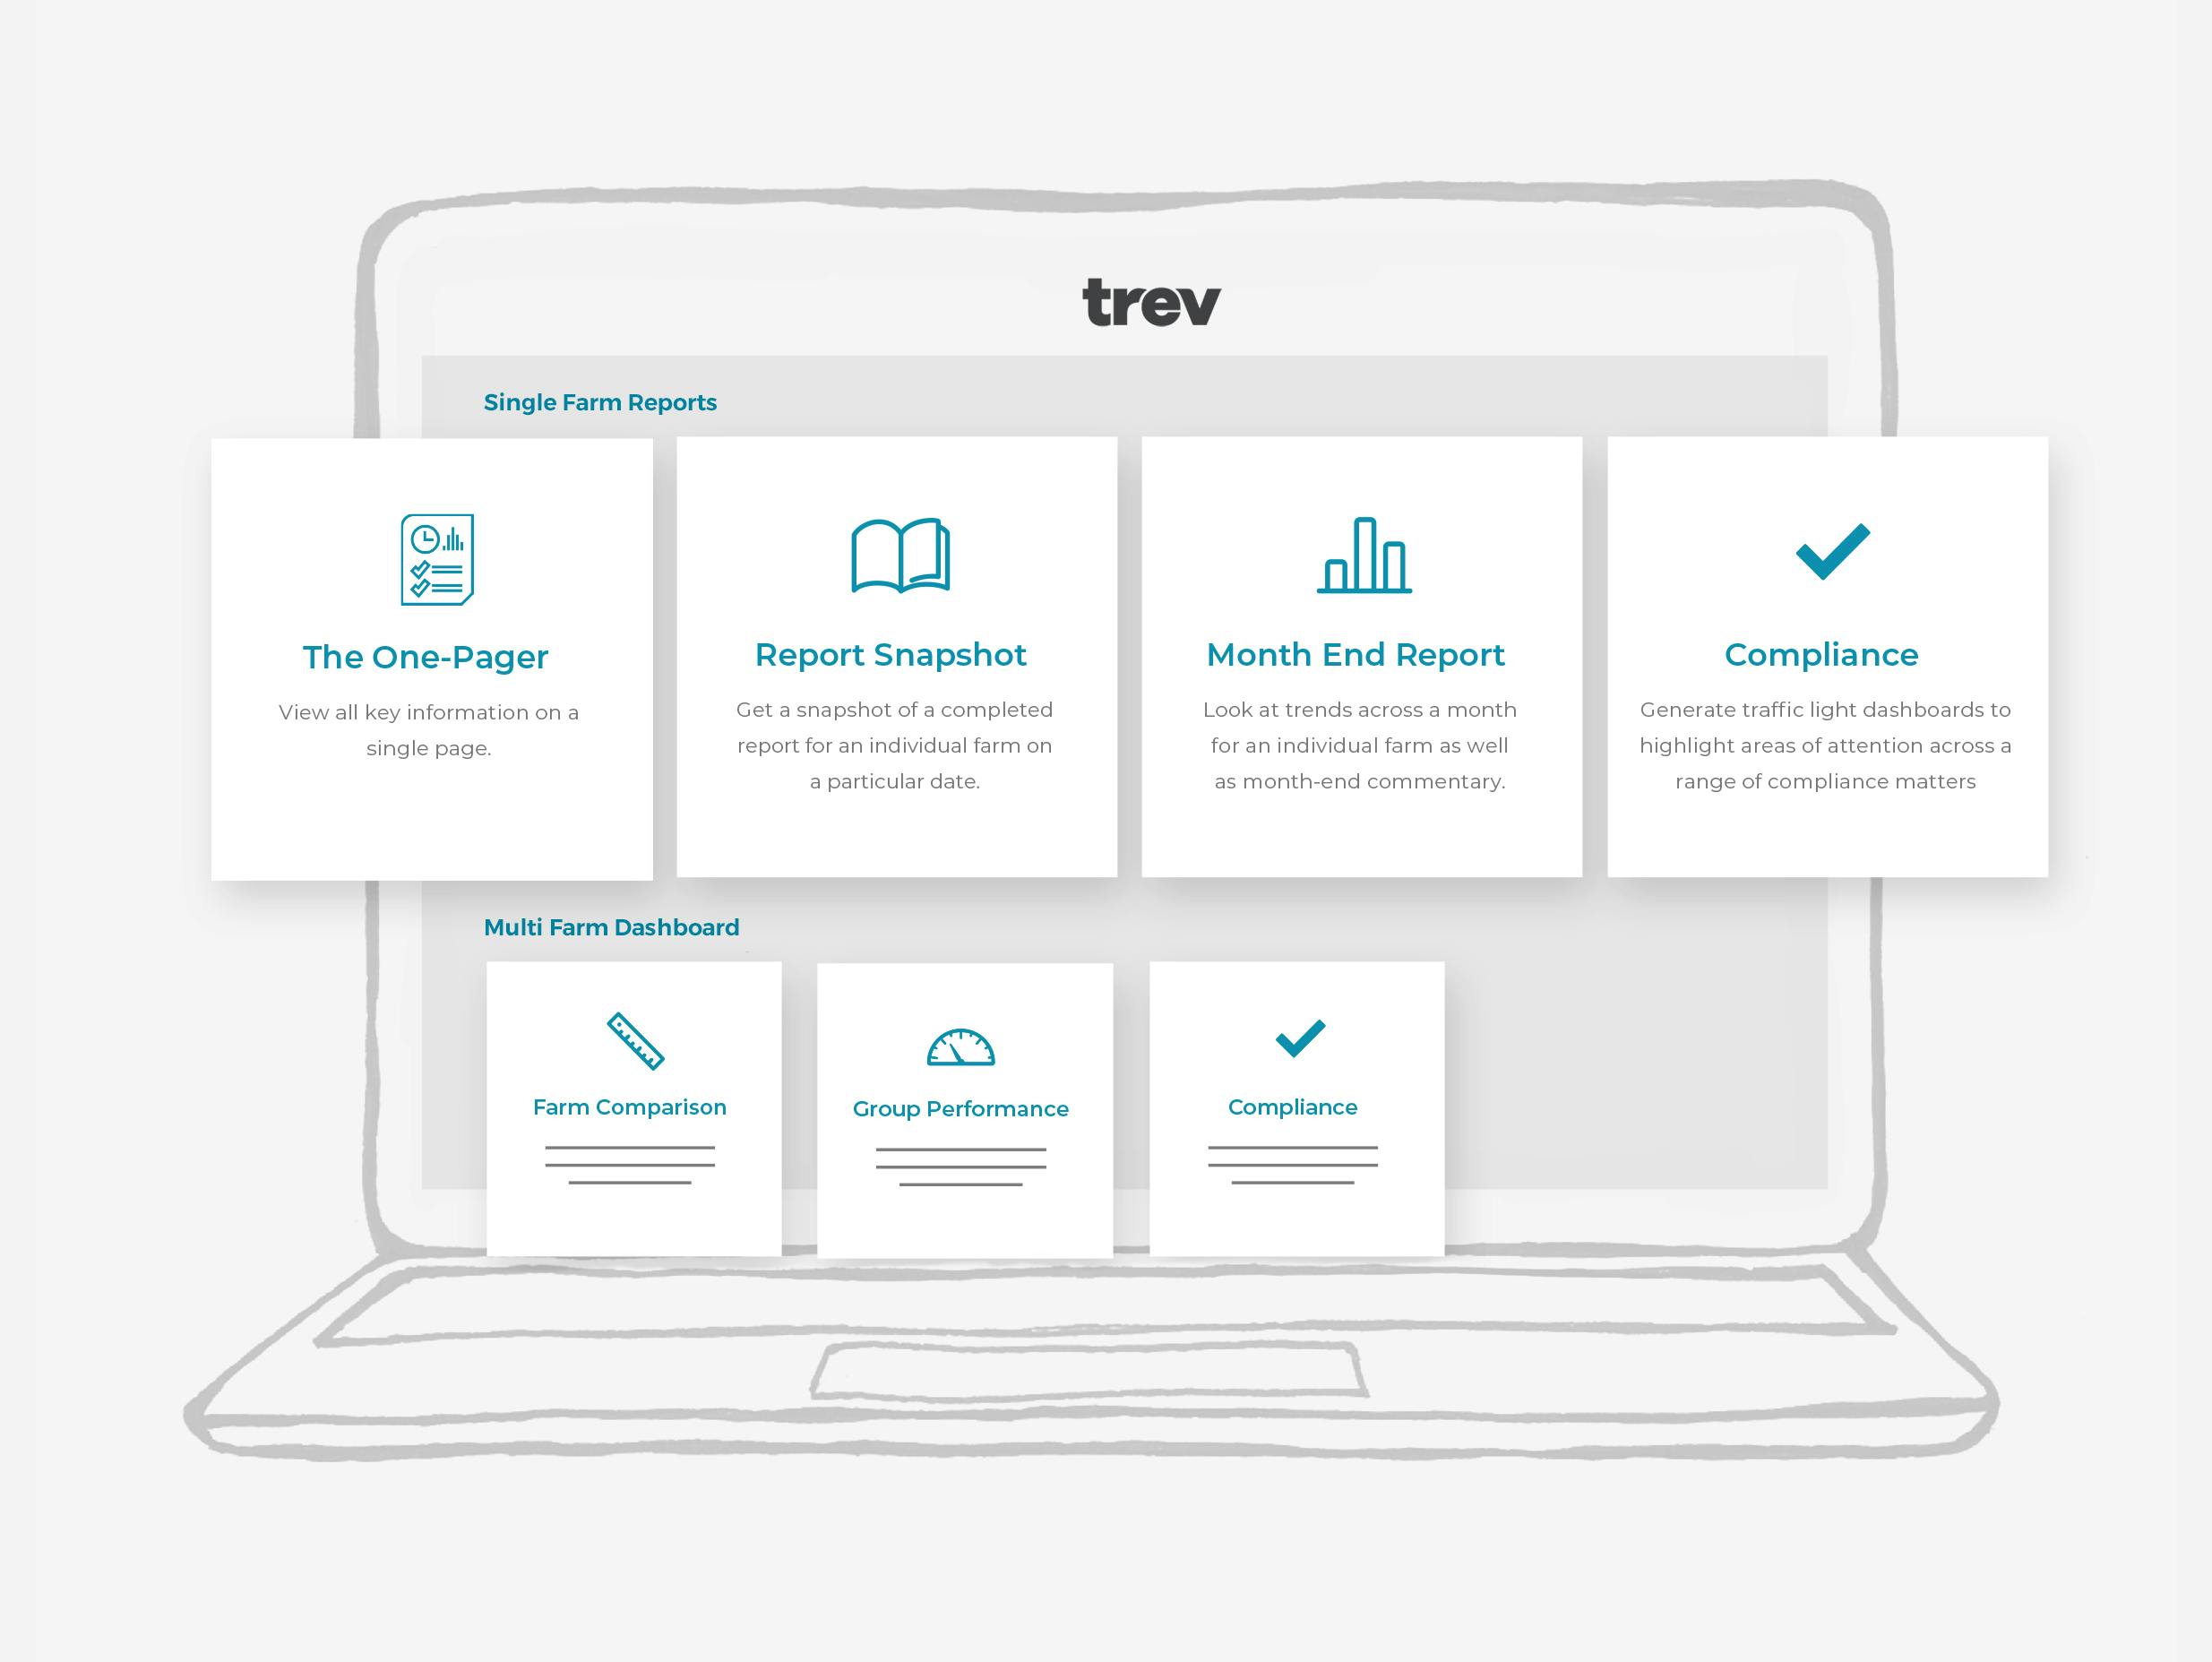
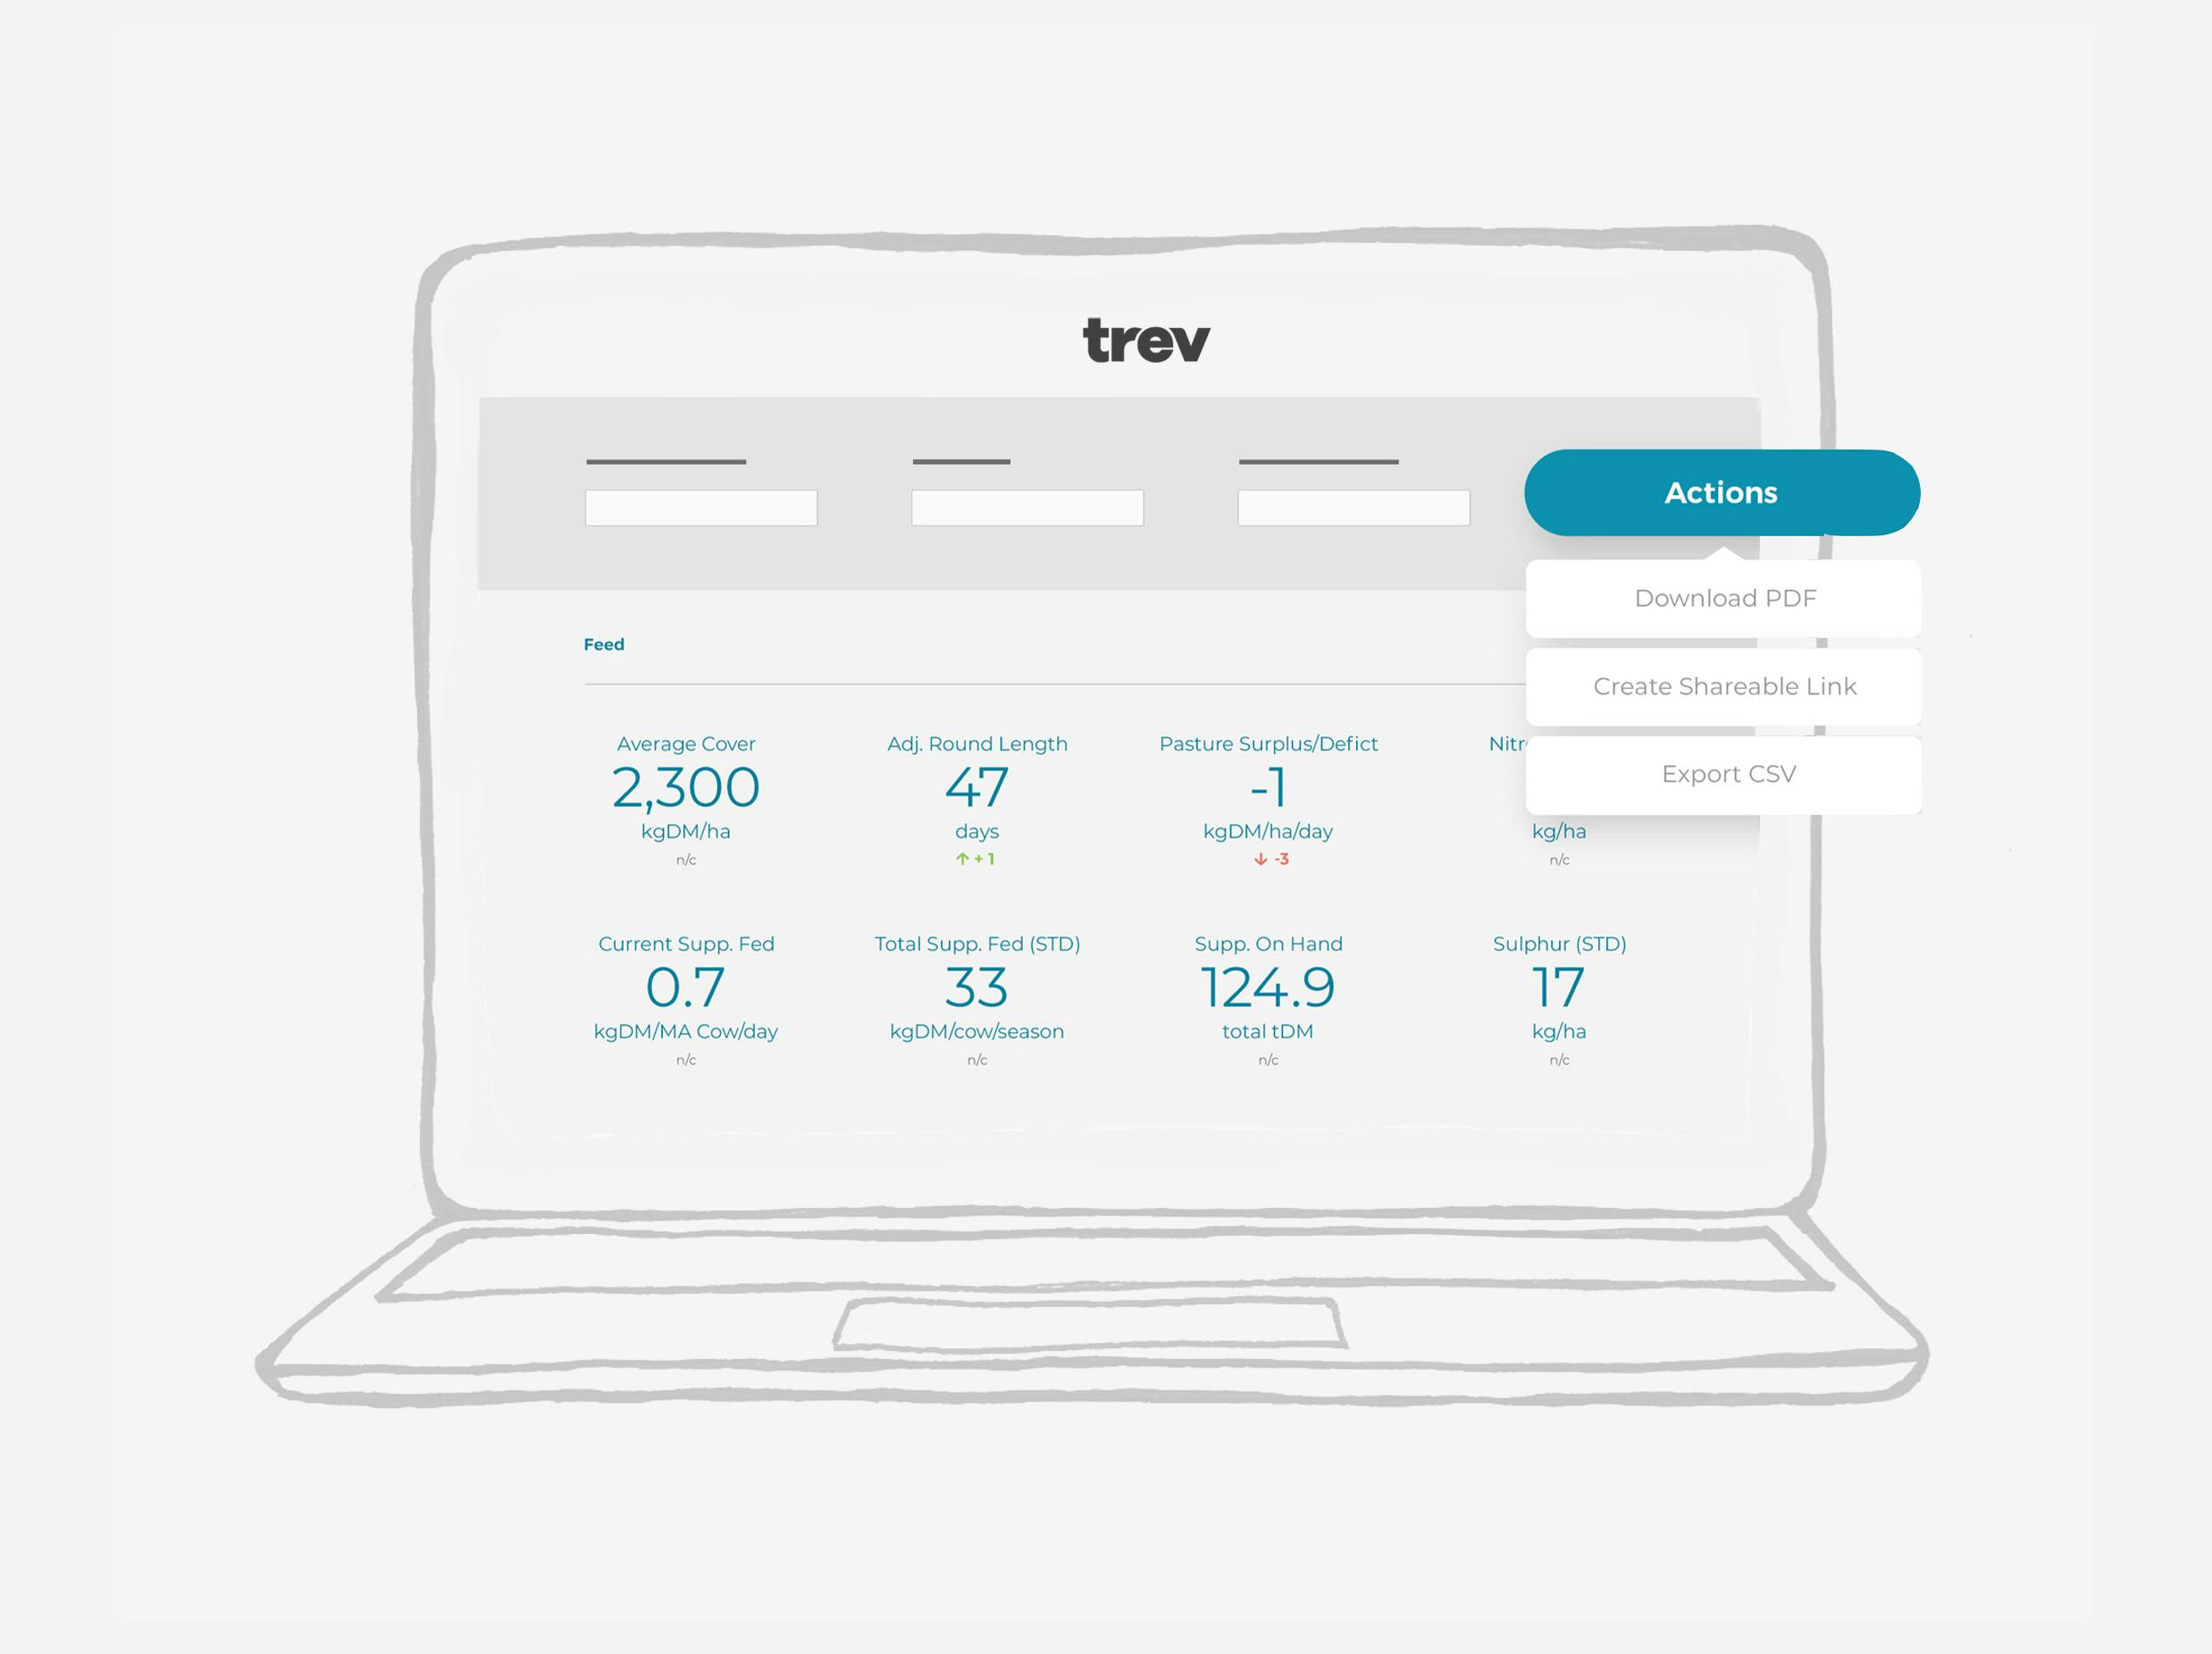
Single Farm Reports
Drill into the specifics for a farm, or get a short sharp rundown of the current situation.
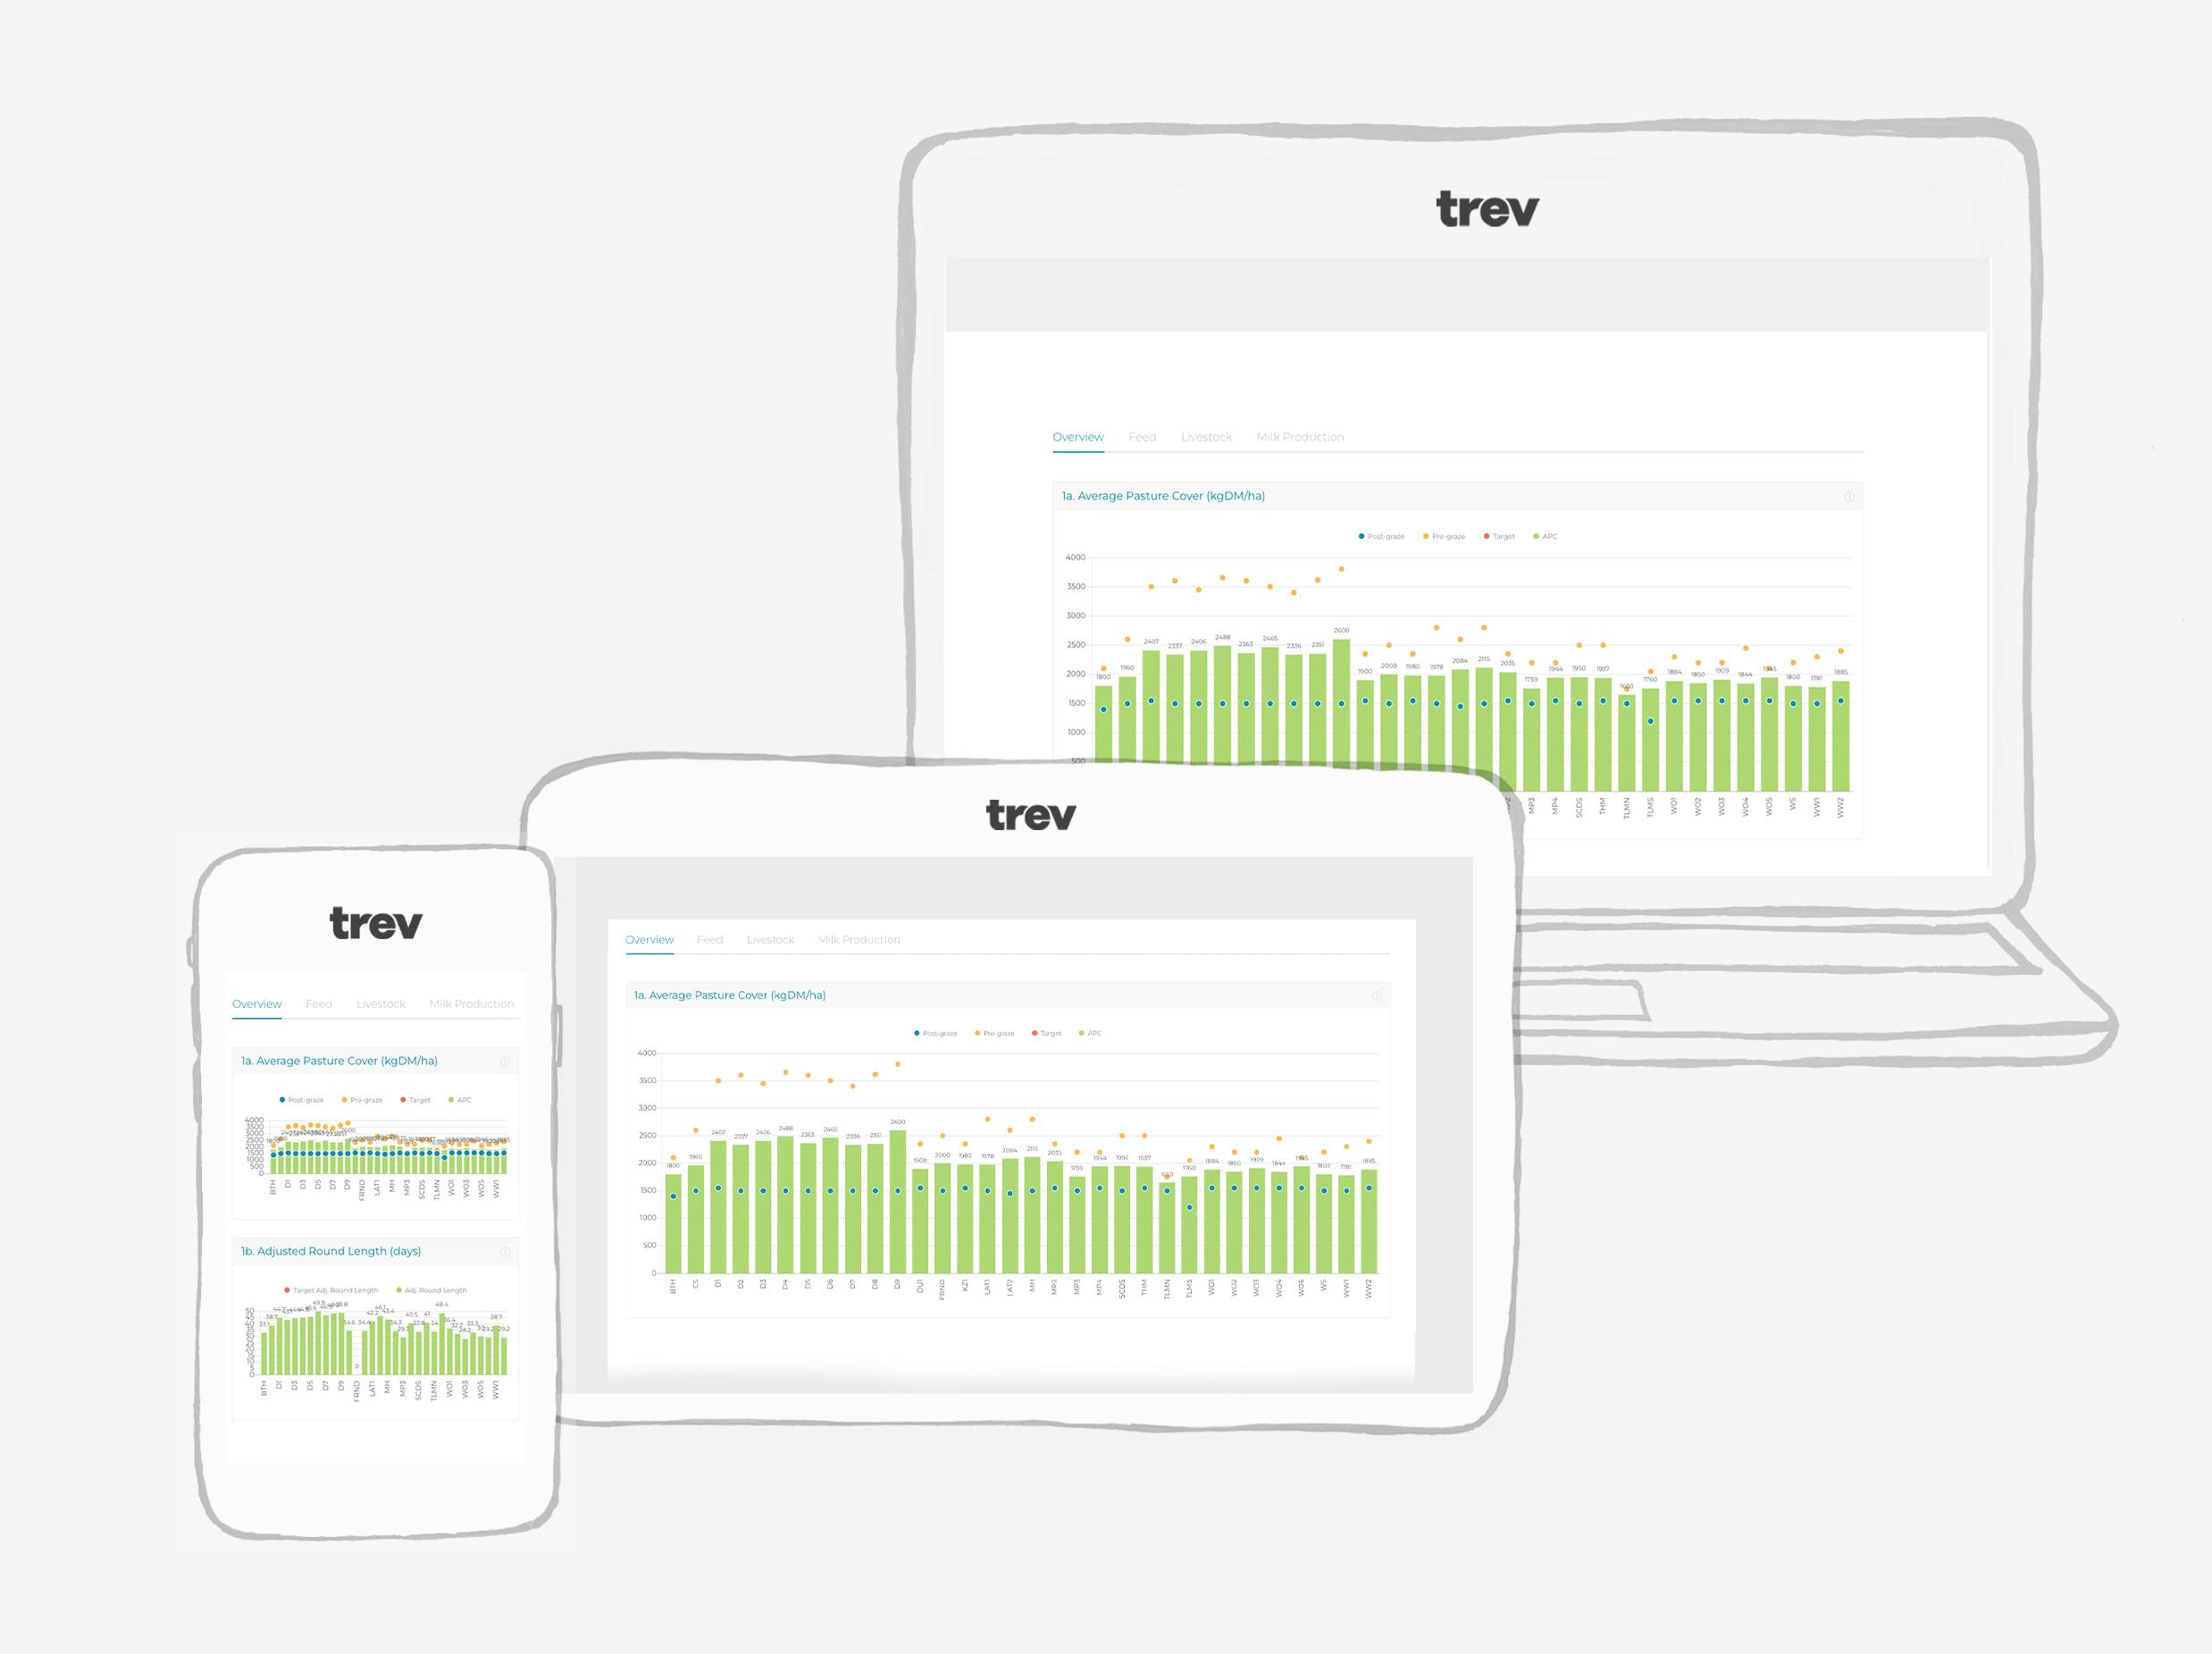
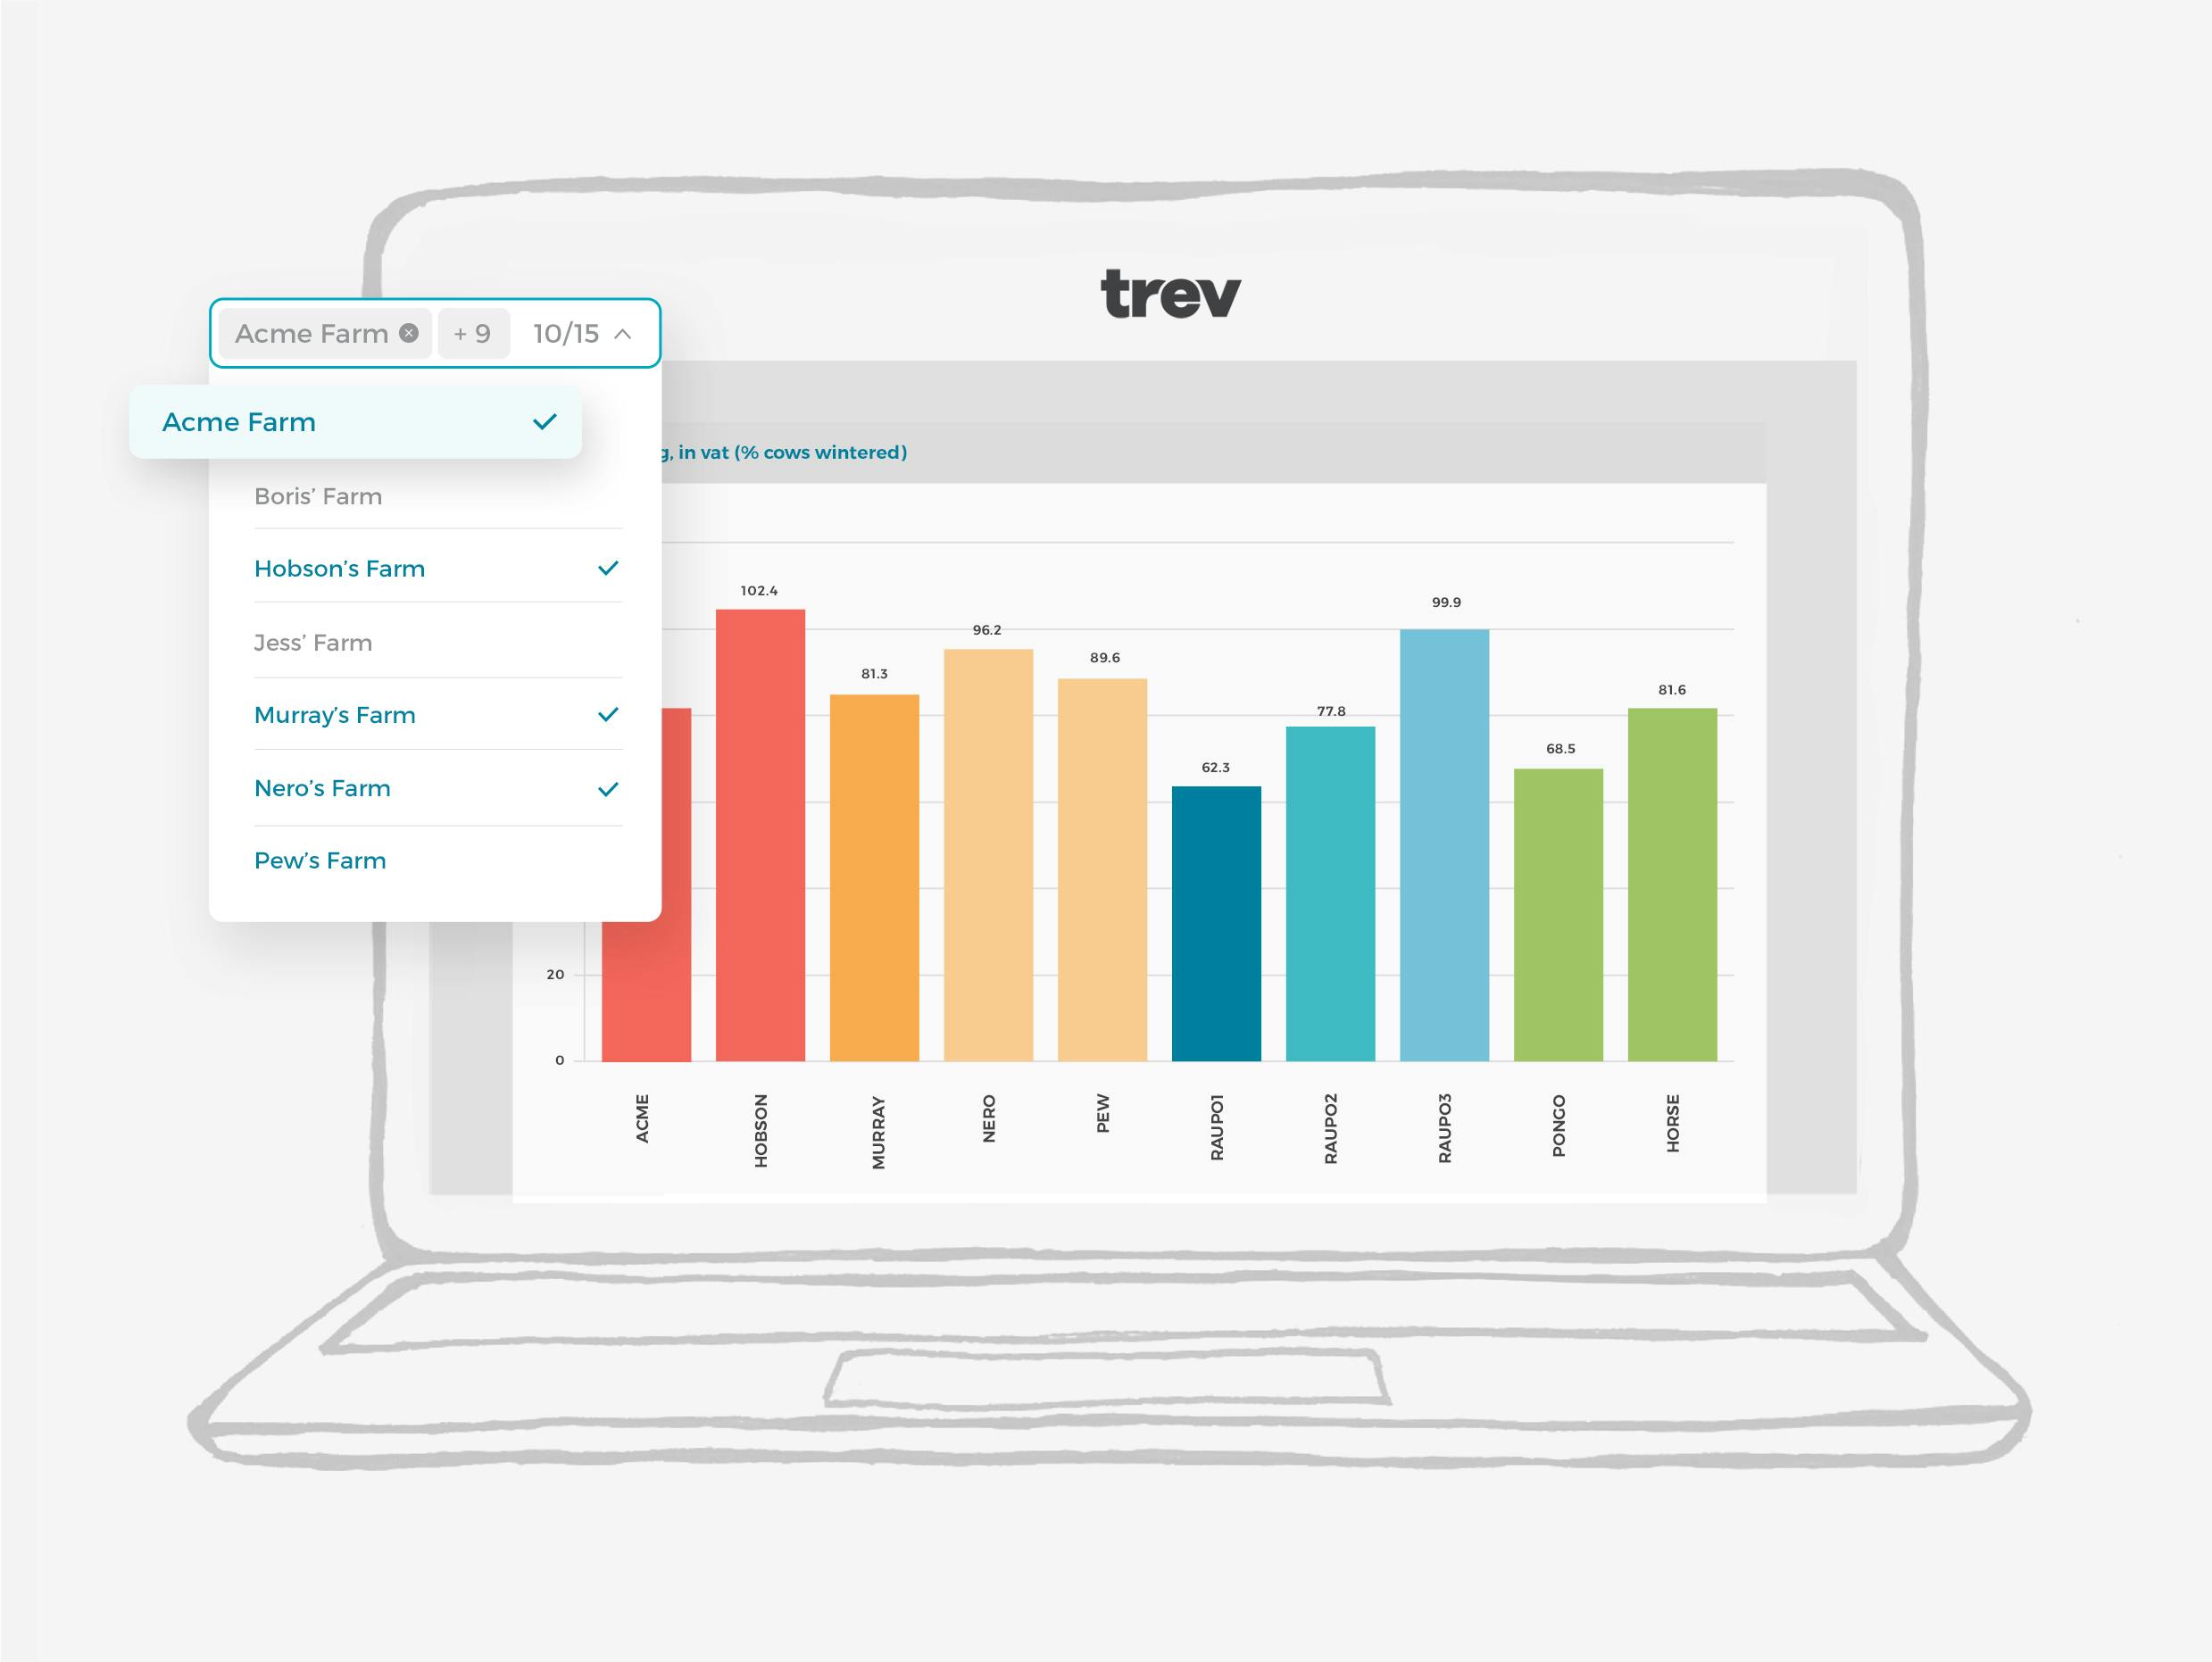
Multi-Farm Dashboard
All your data on one dashboard. Whether you’ve got one, five or fifty farms, monitor and compare performance across the board.
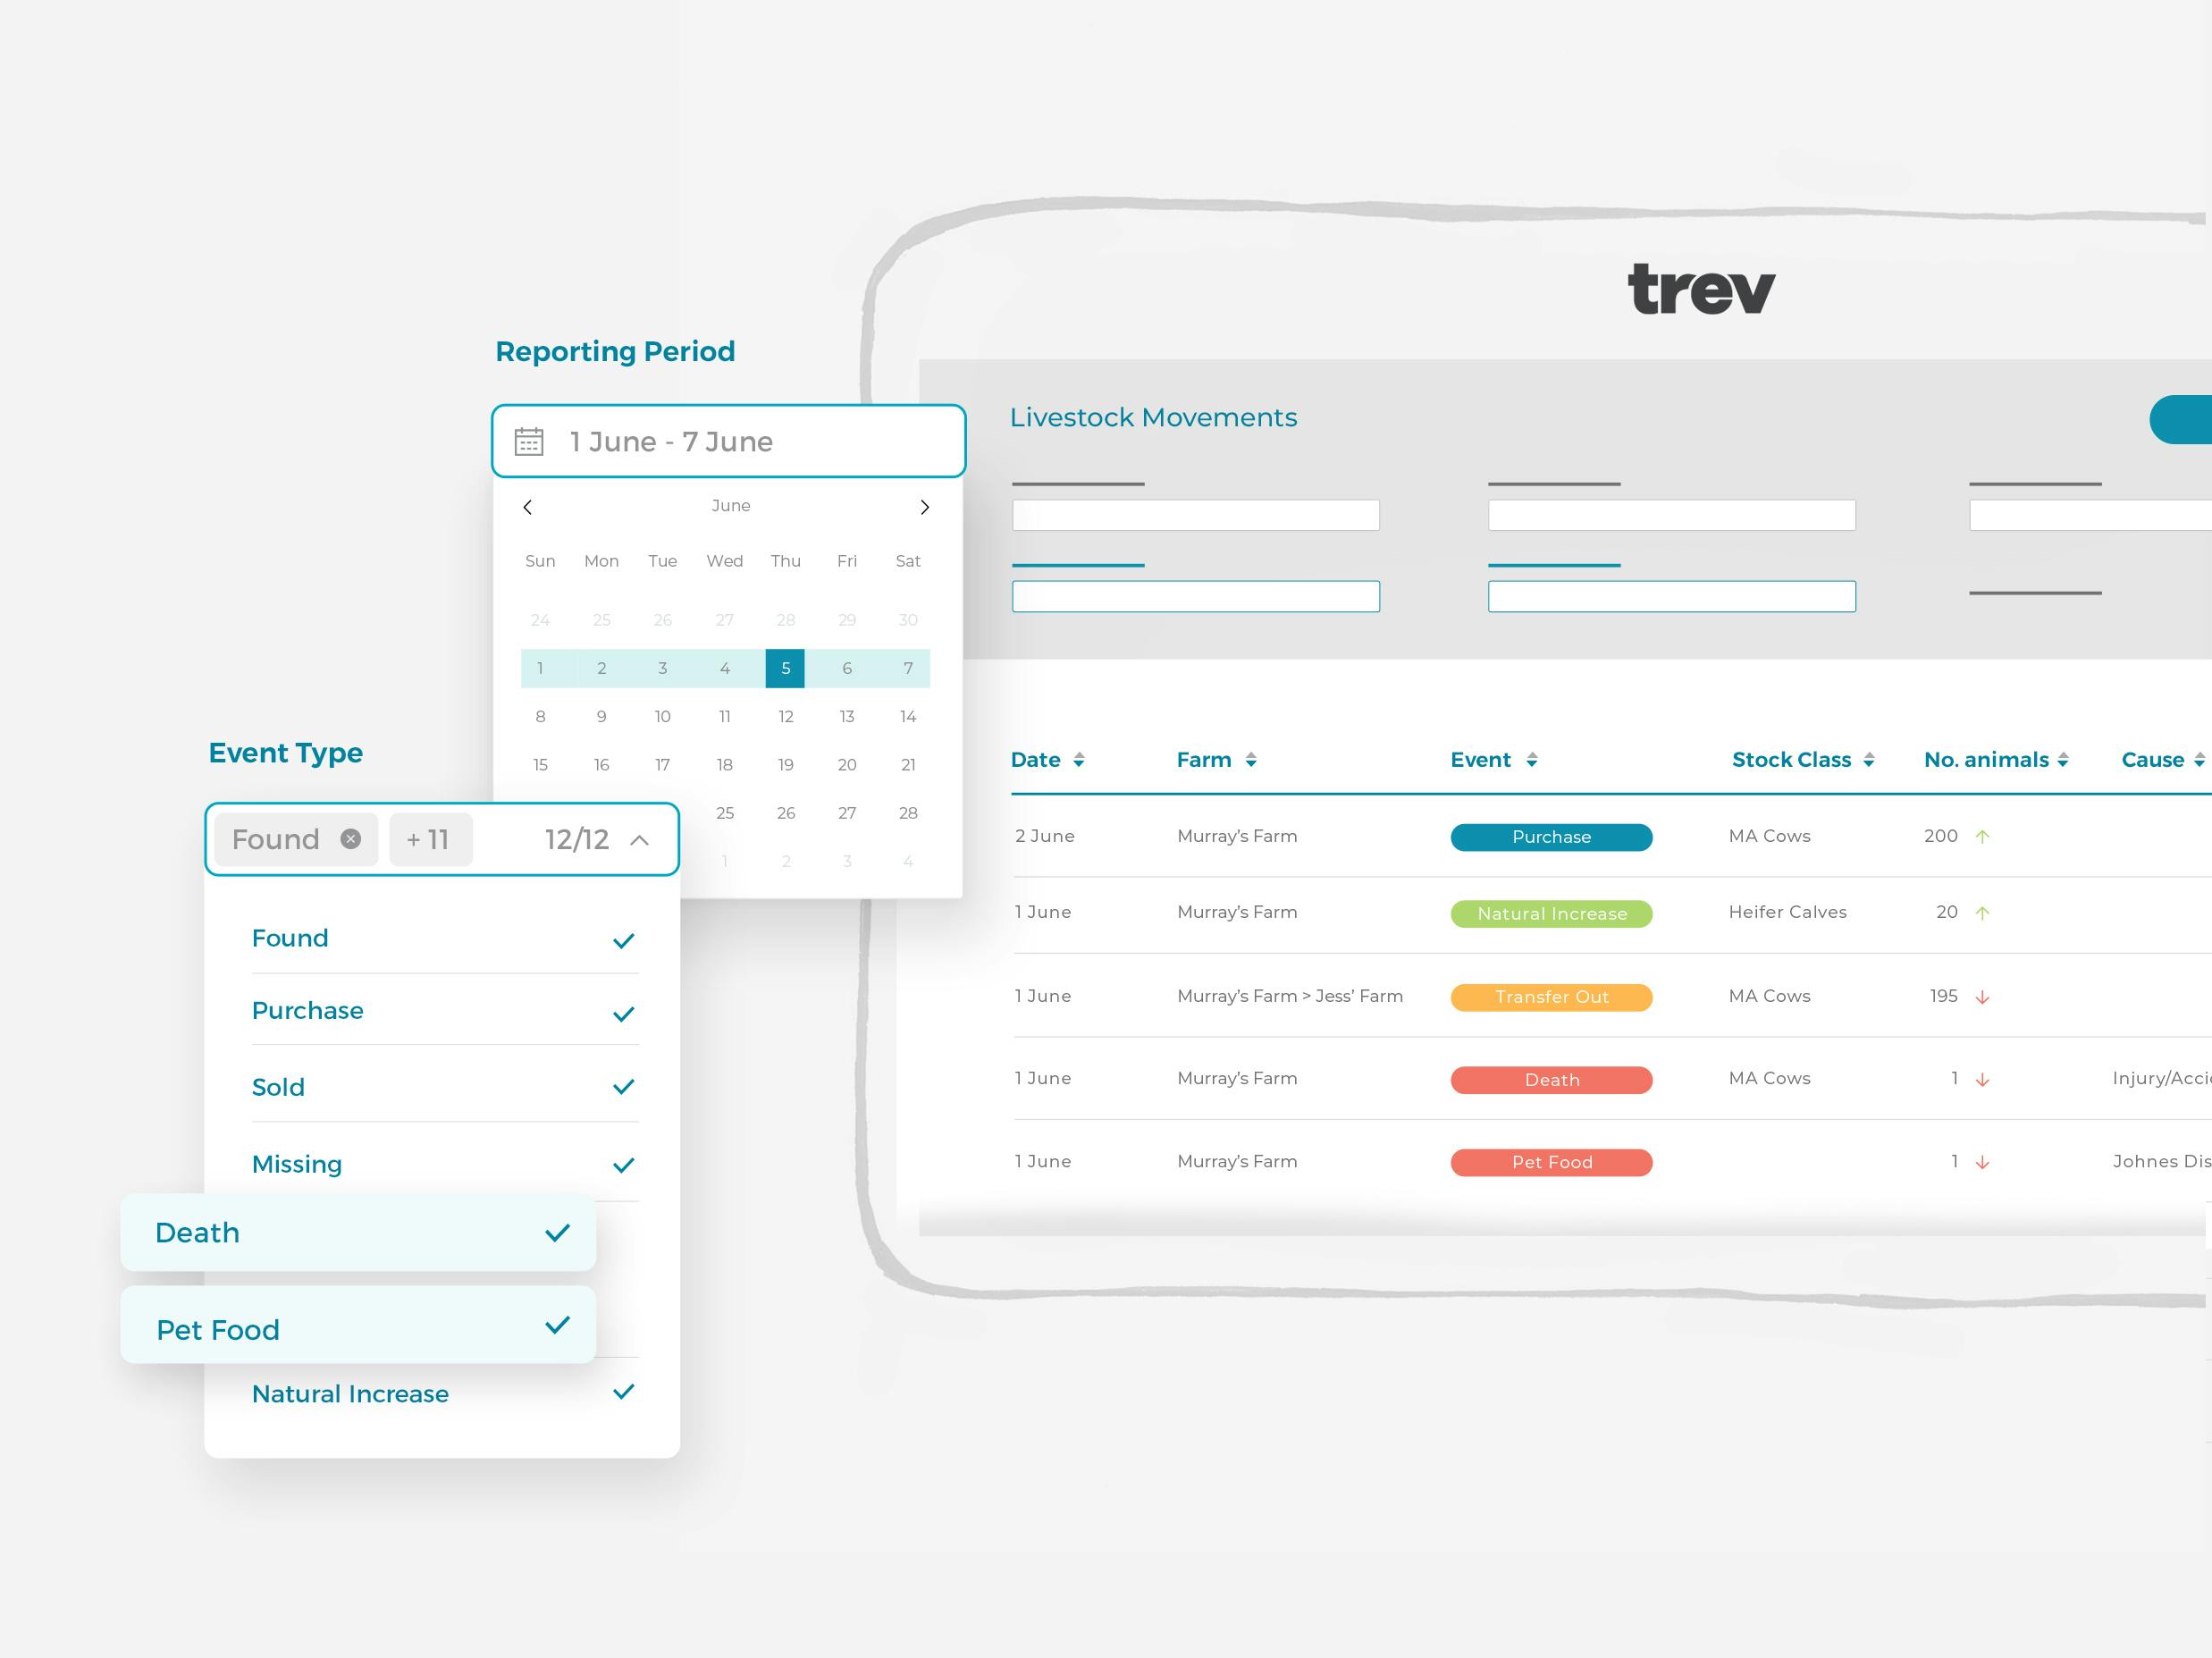
Detailed Reports
Break it down or build it up. Get down and dirty with your data using custom filters to get exactly what you need.
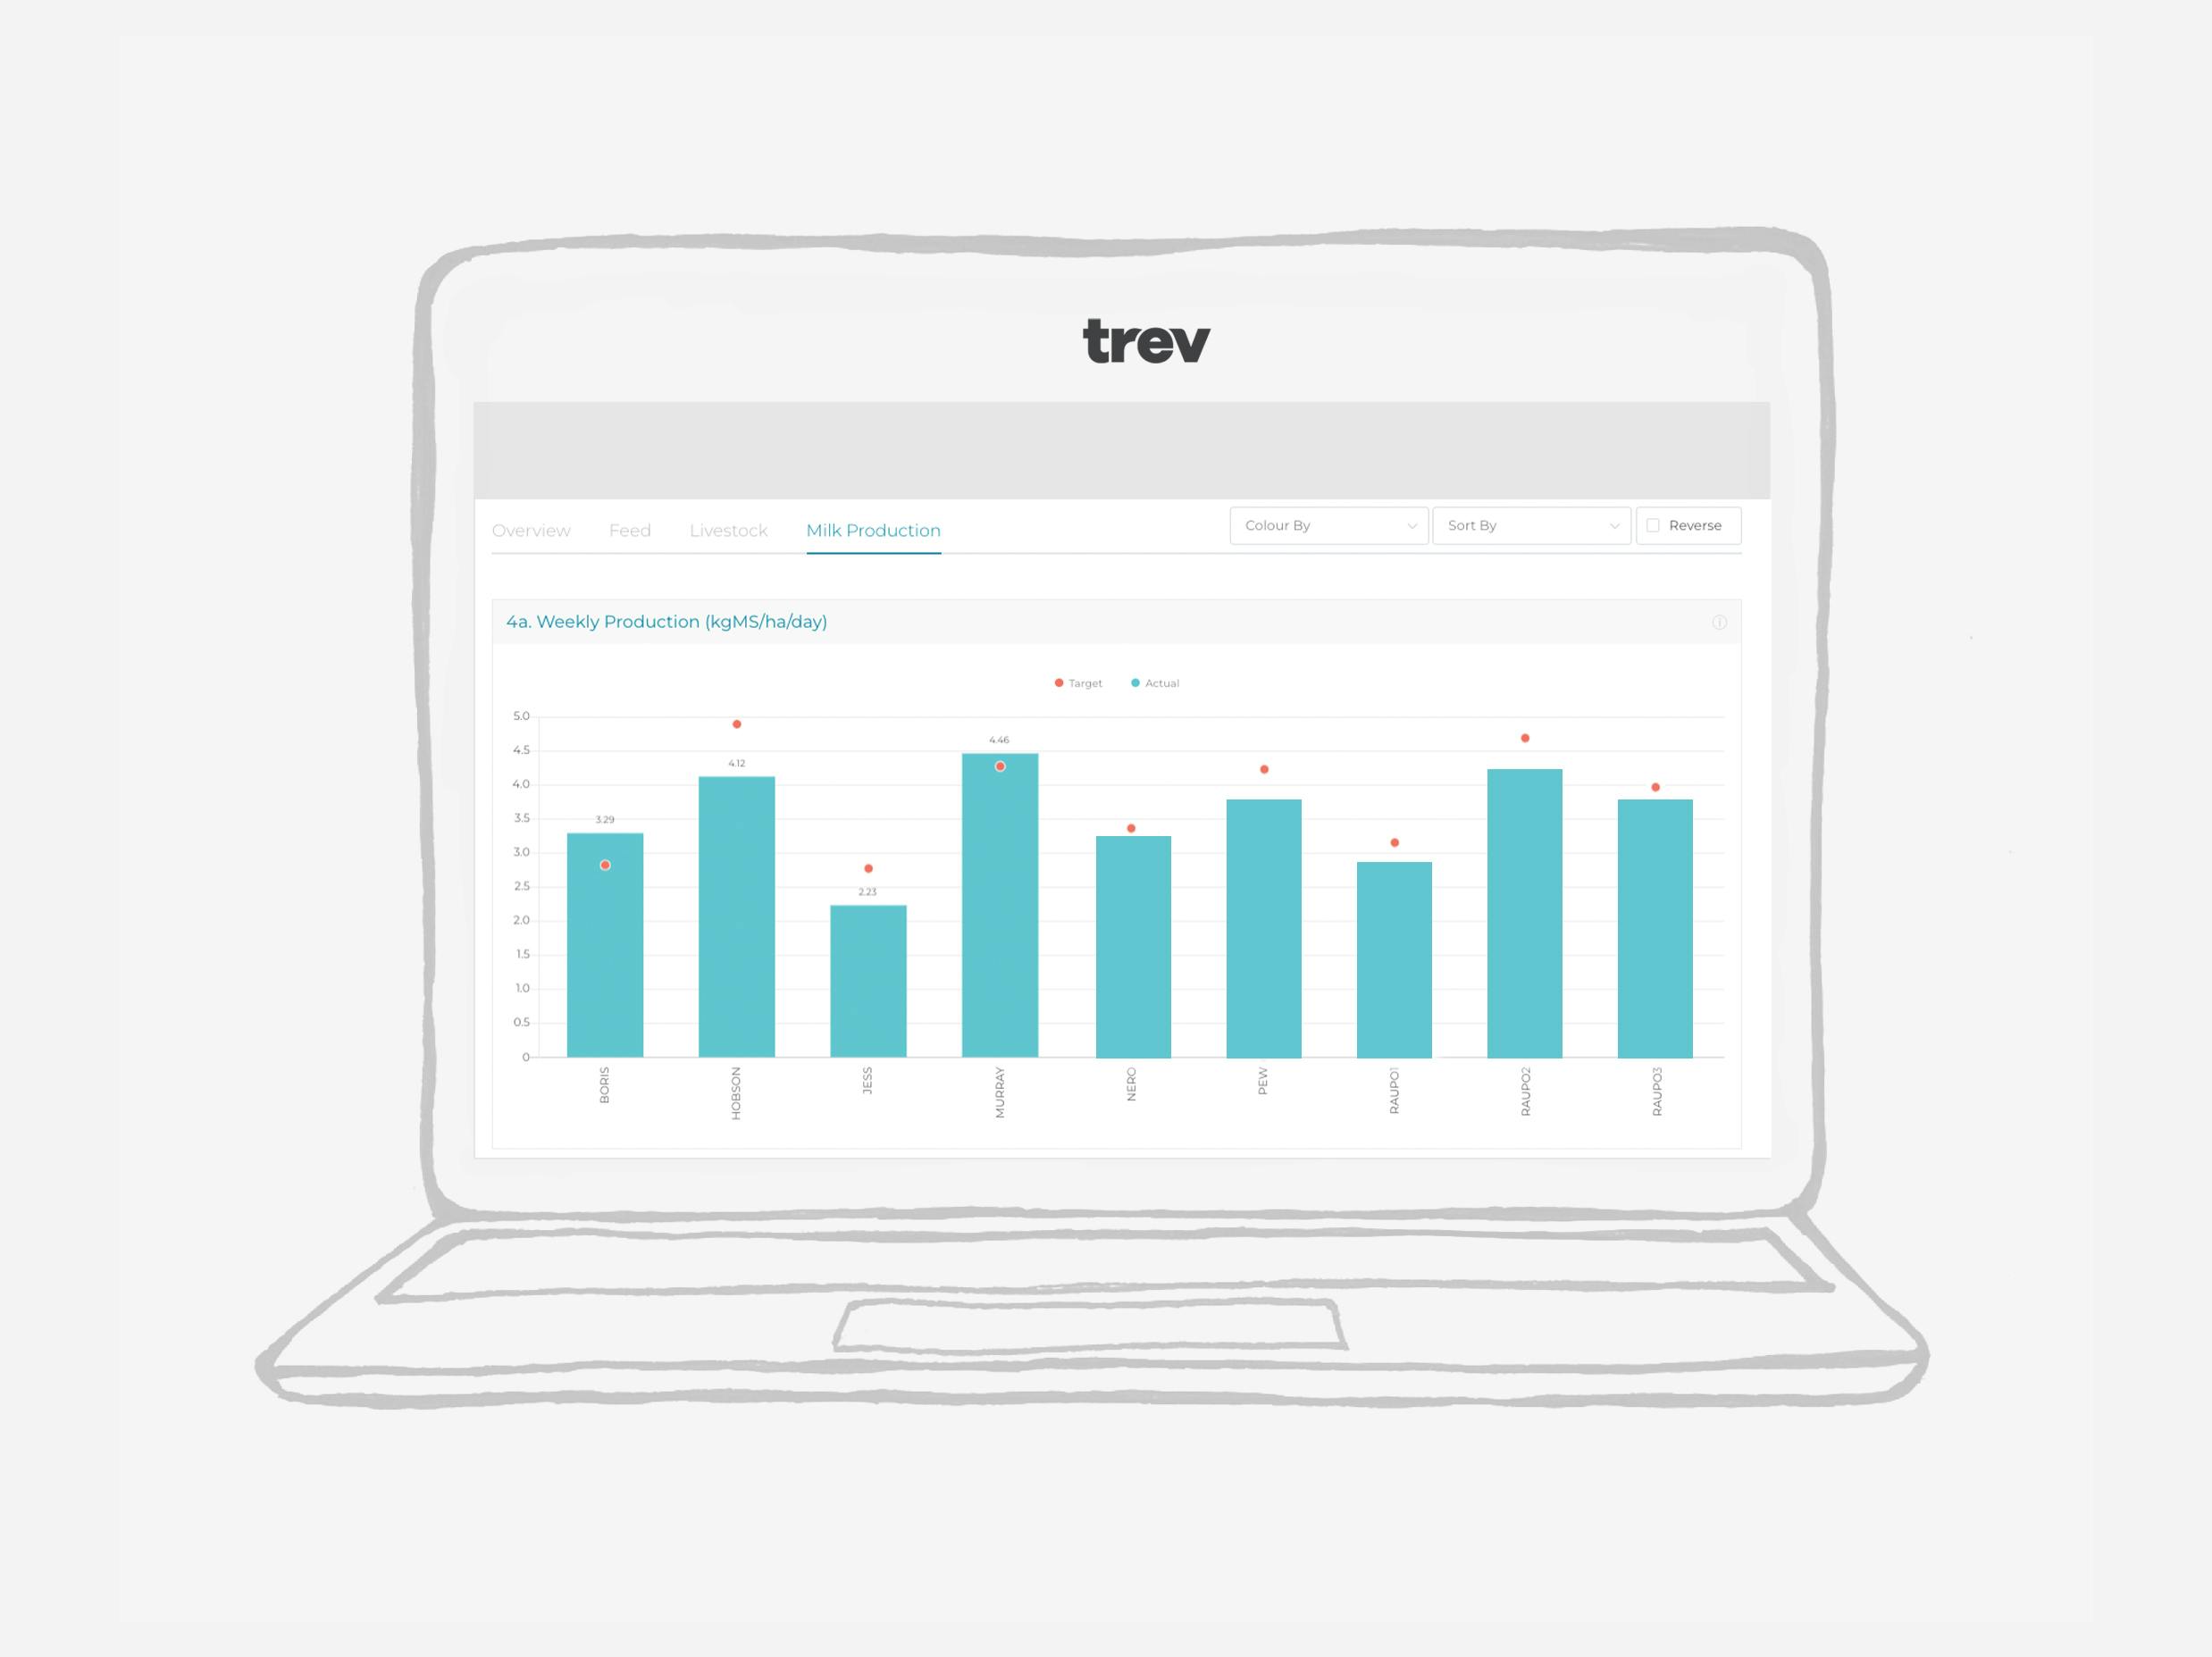
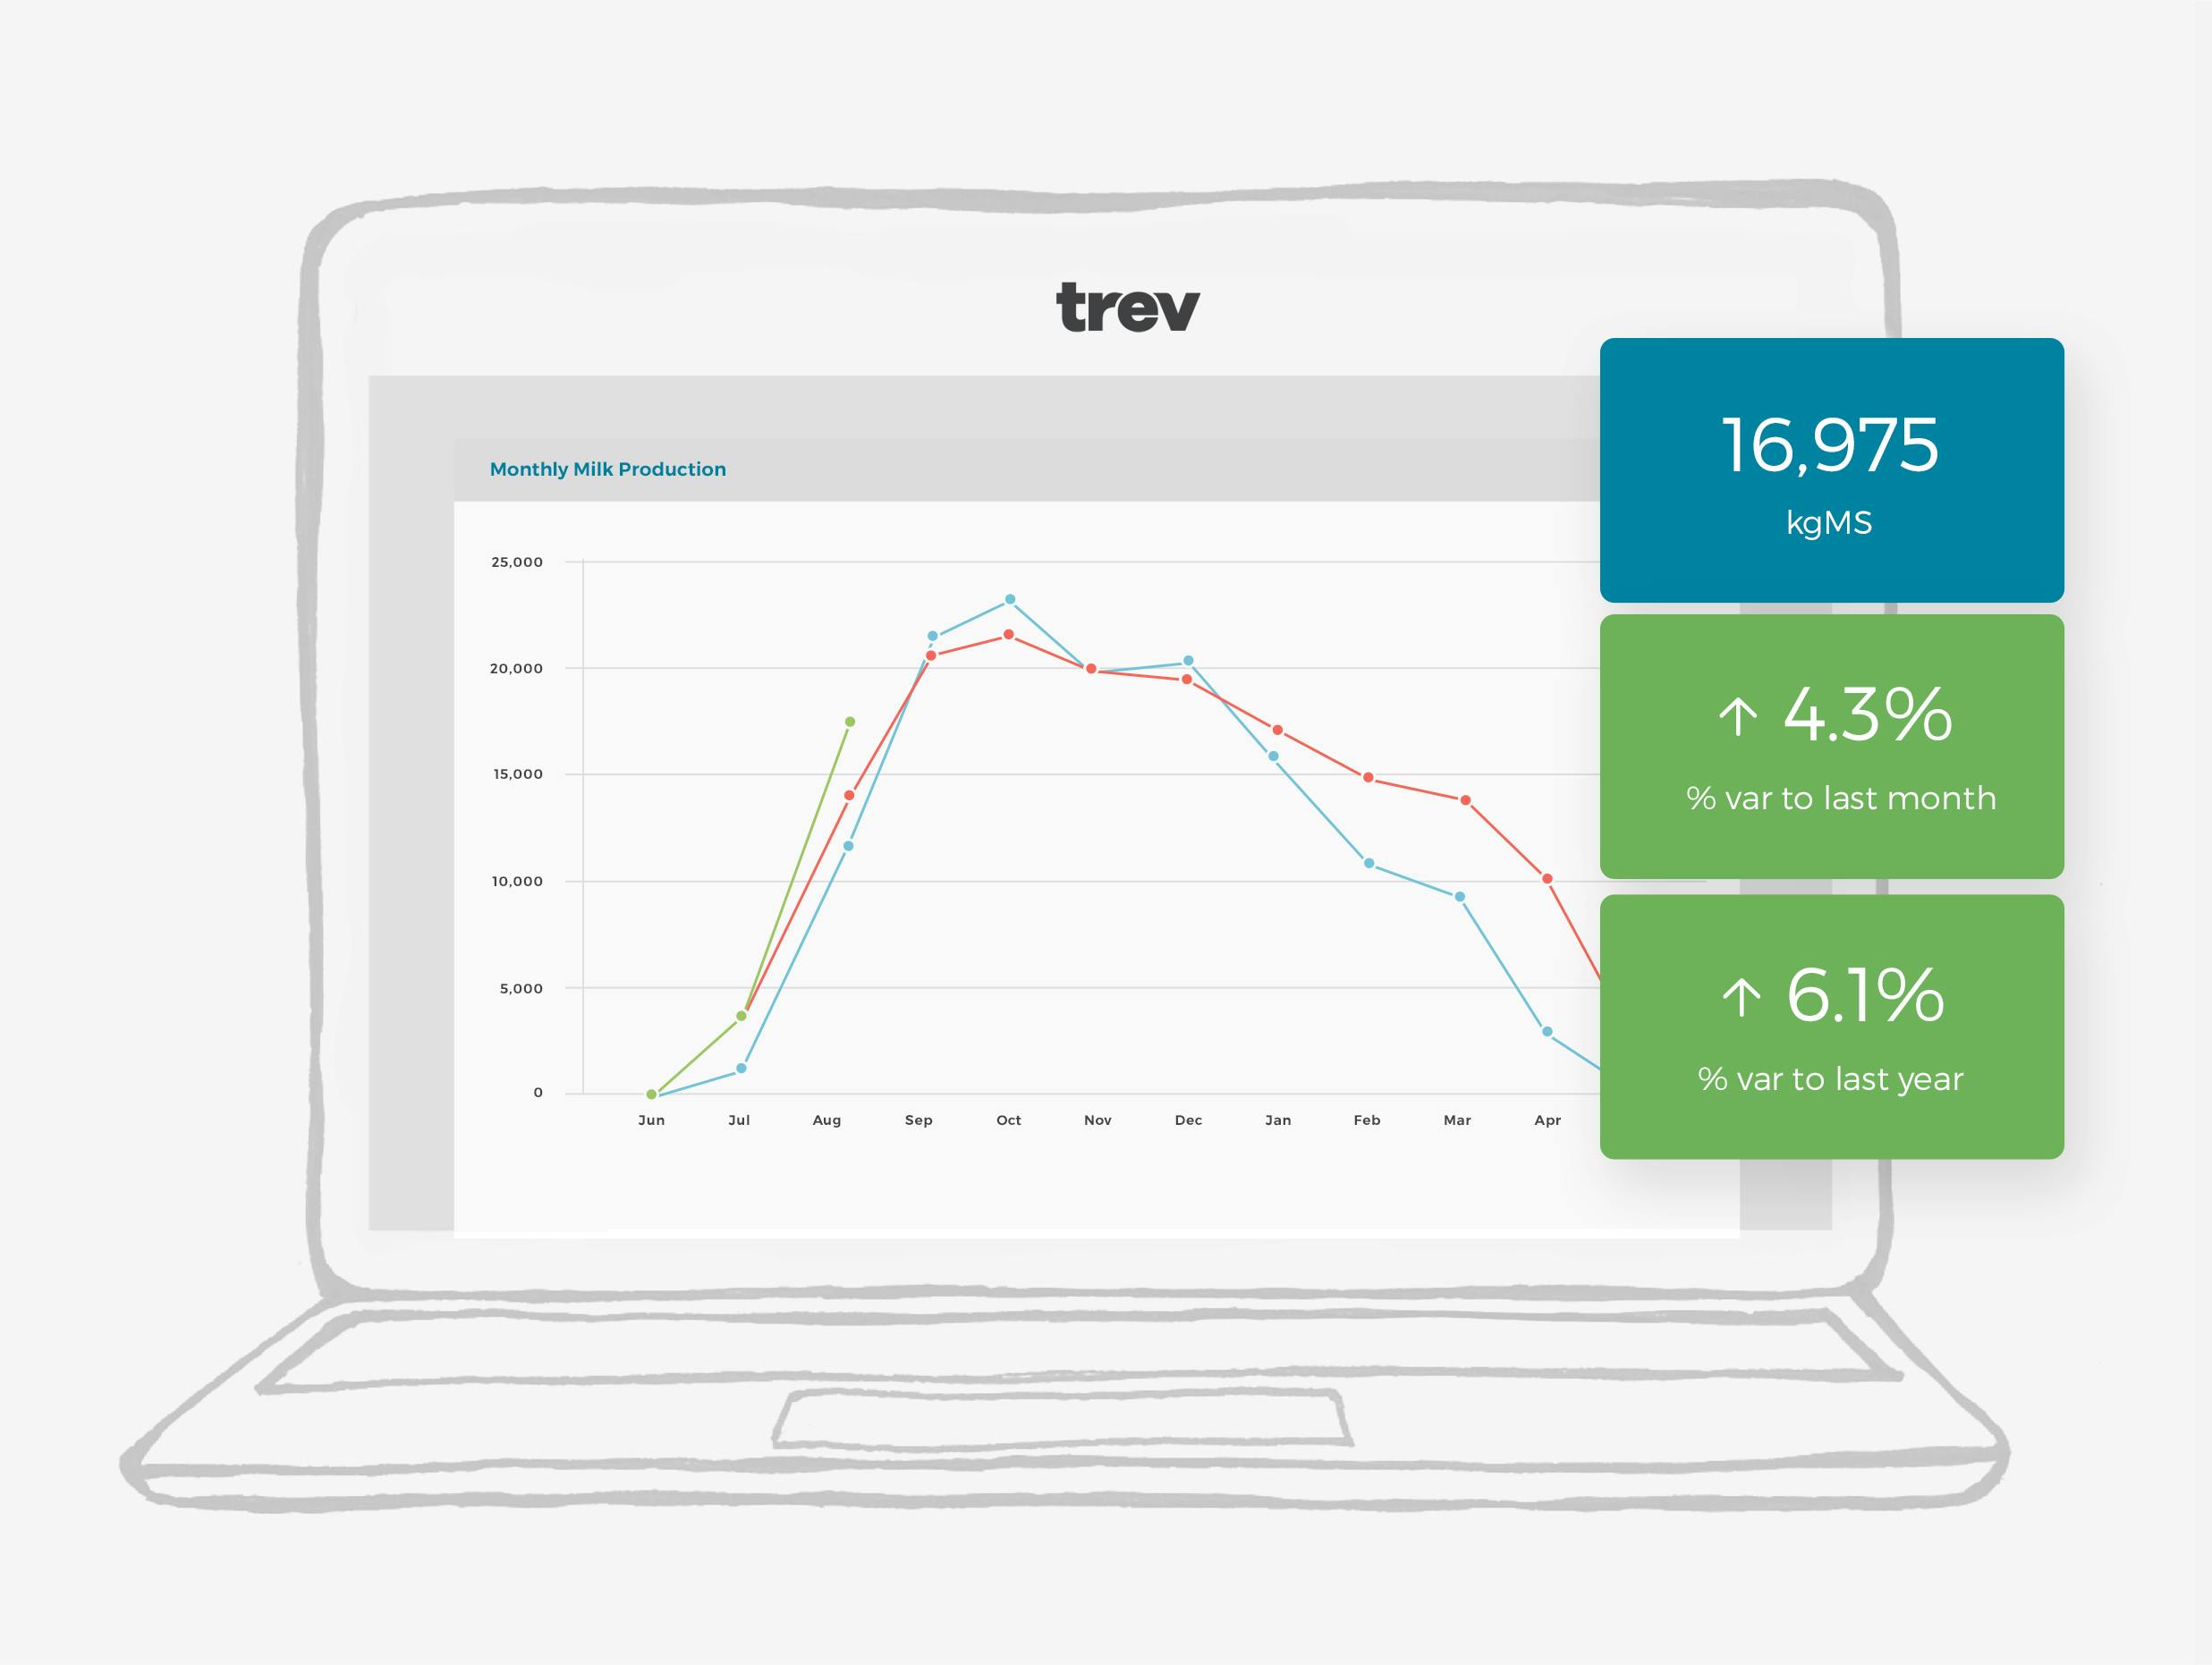
Track Against Targets
Know exactly how you’re tracking against budget with customisable targets for all the key metrics, such as milk production or APC.
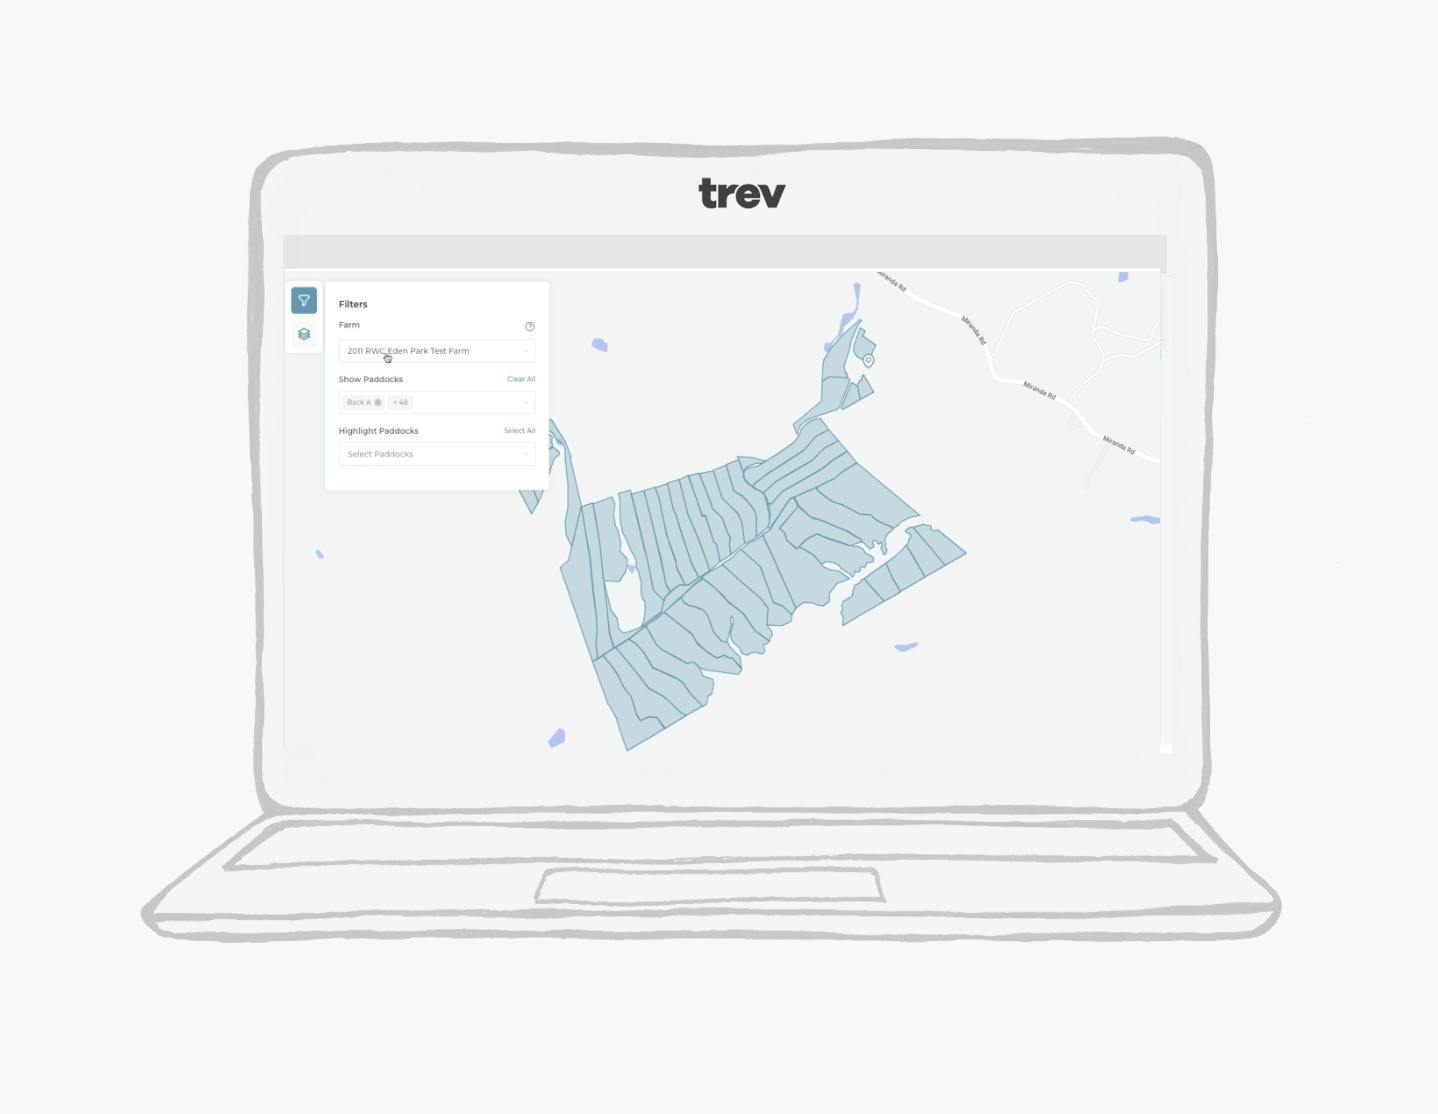
Map & Calendar Views
Your data, your way. View your farm events in map or calendar view with Trev.

Learn.
Get powerful insights into what’s happening across your operation. Use Trev’s smarts to discover trends and patterns in your data for swift decision making.
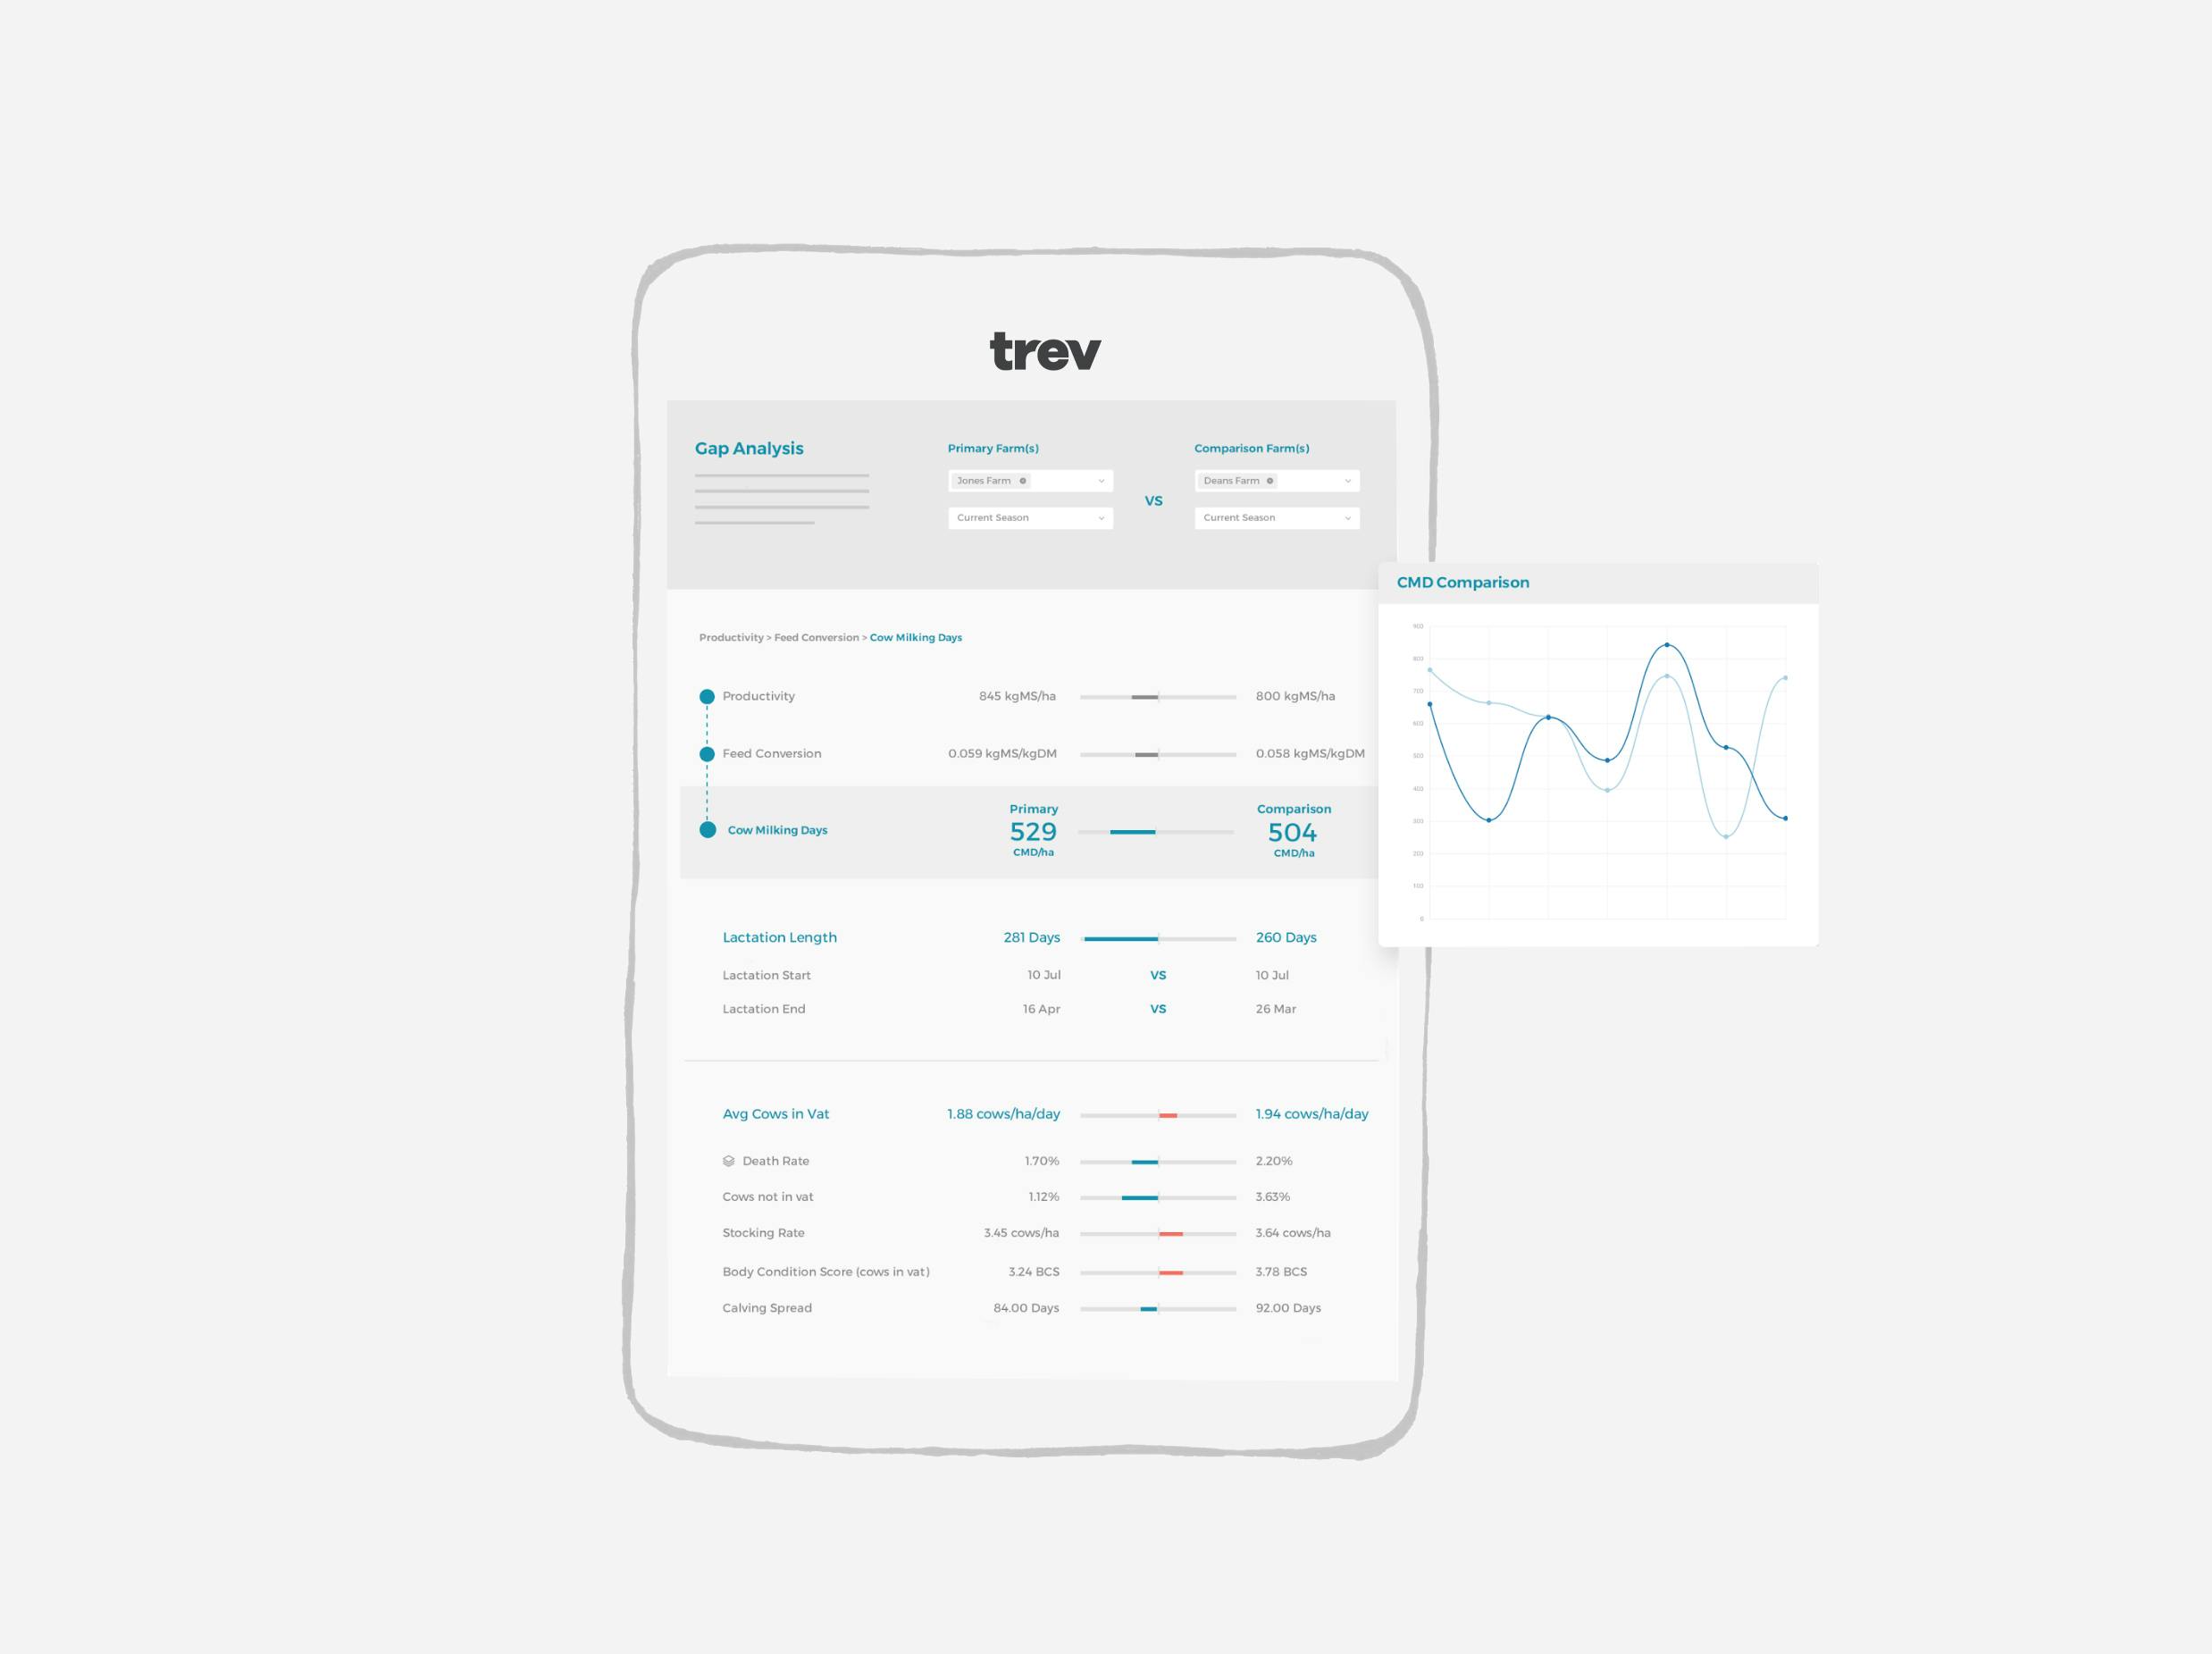
Gap Analysis
Quickly identify and drill into the key drivers of productivity variance between farms.
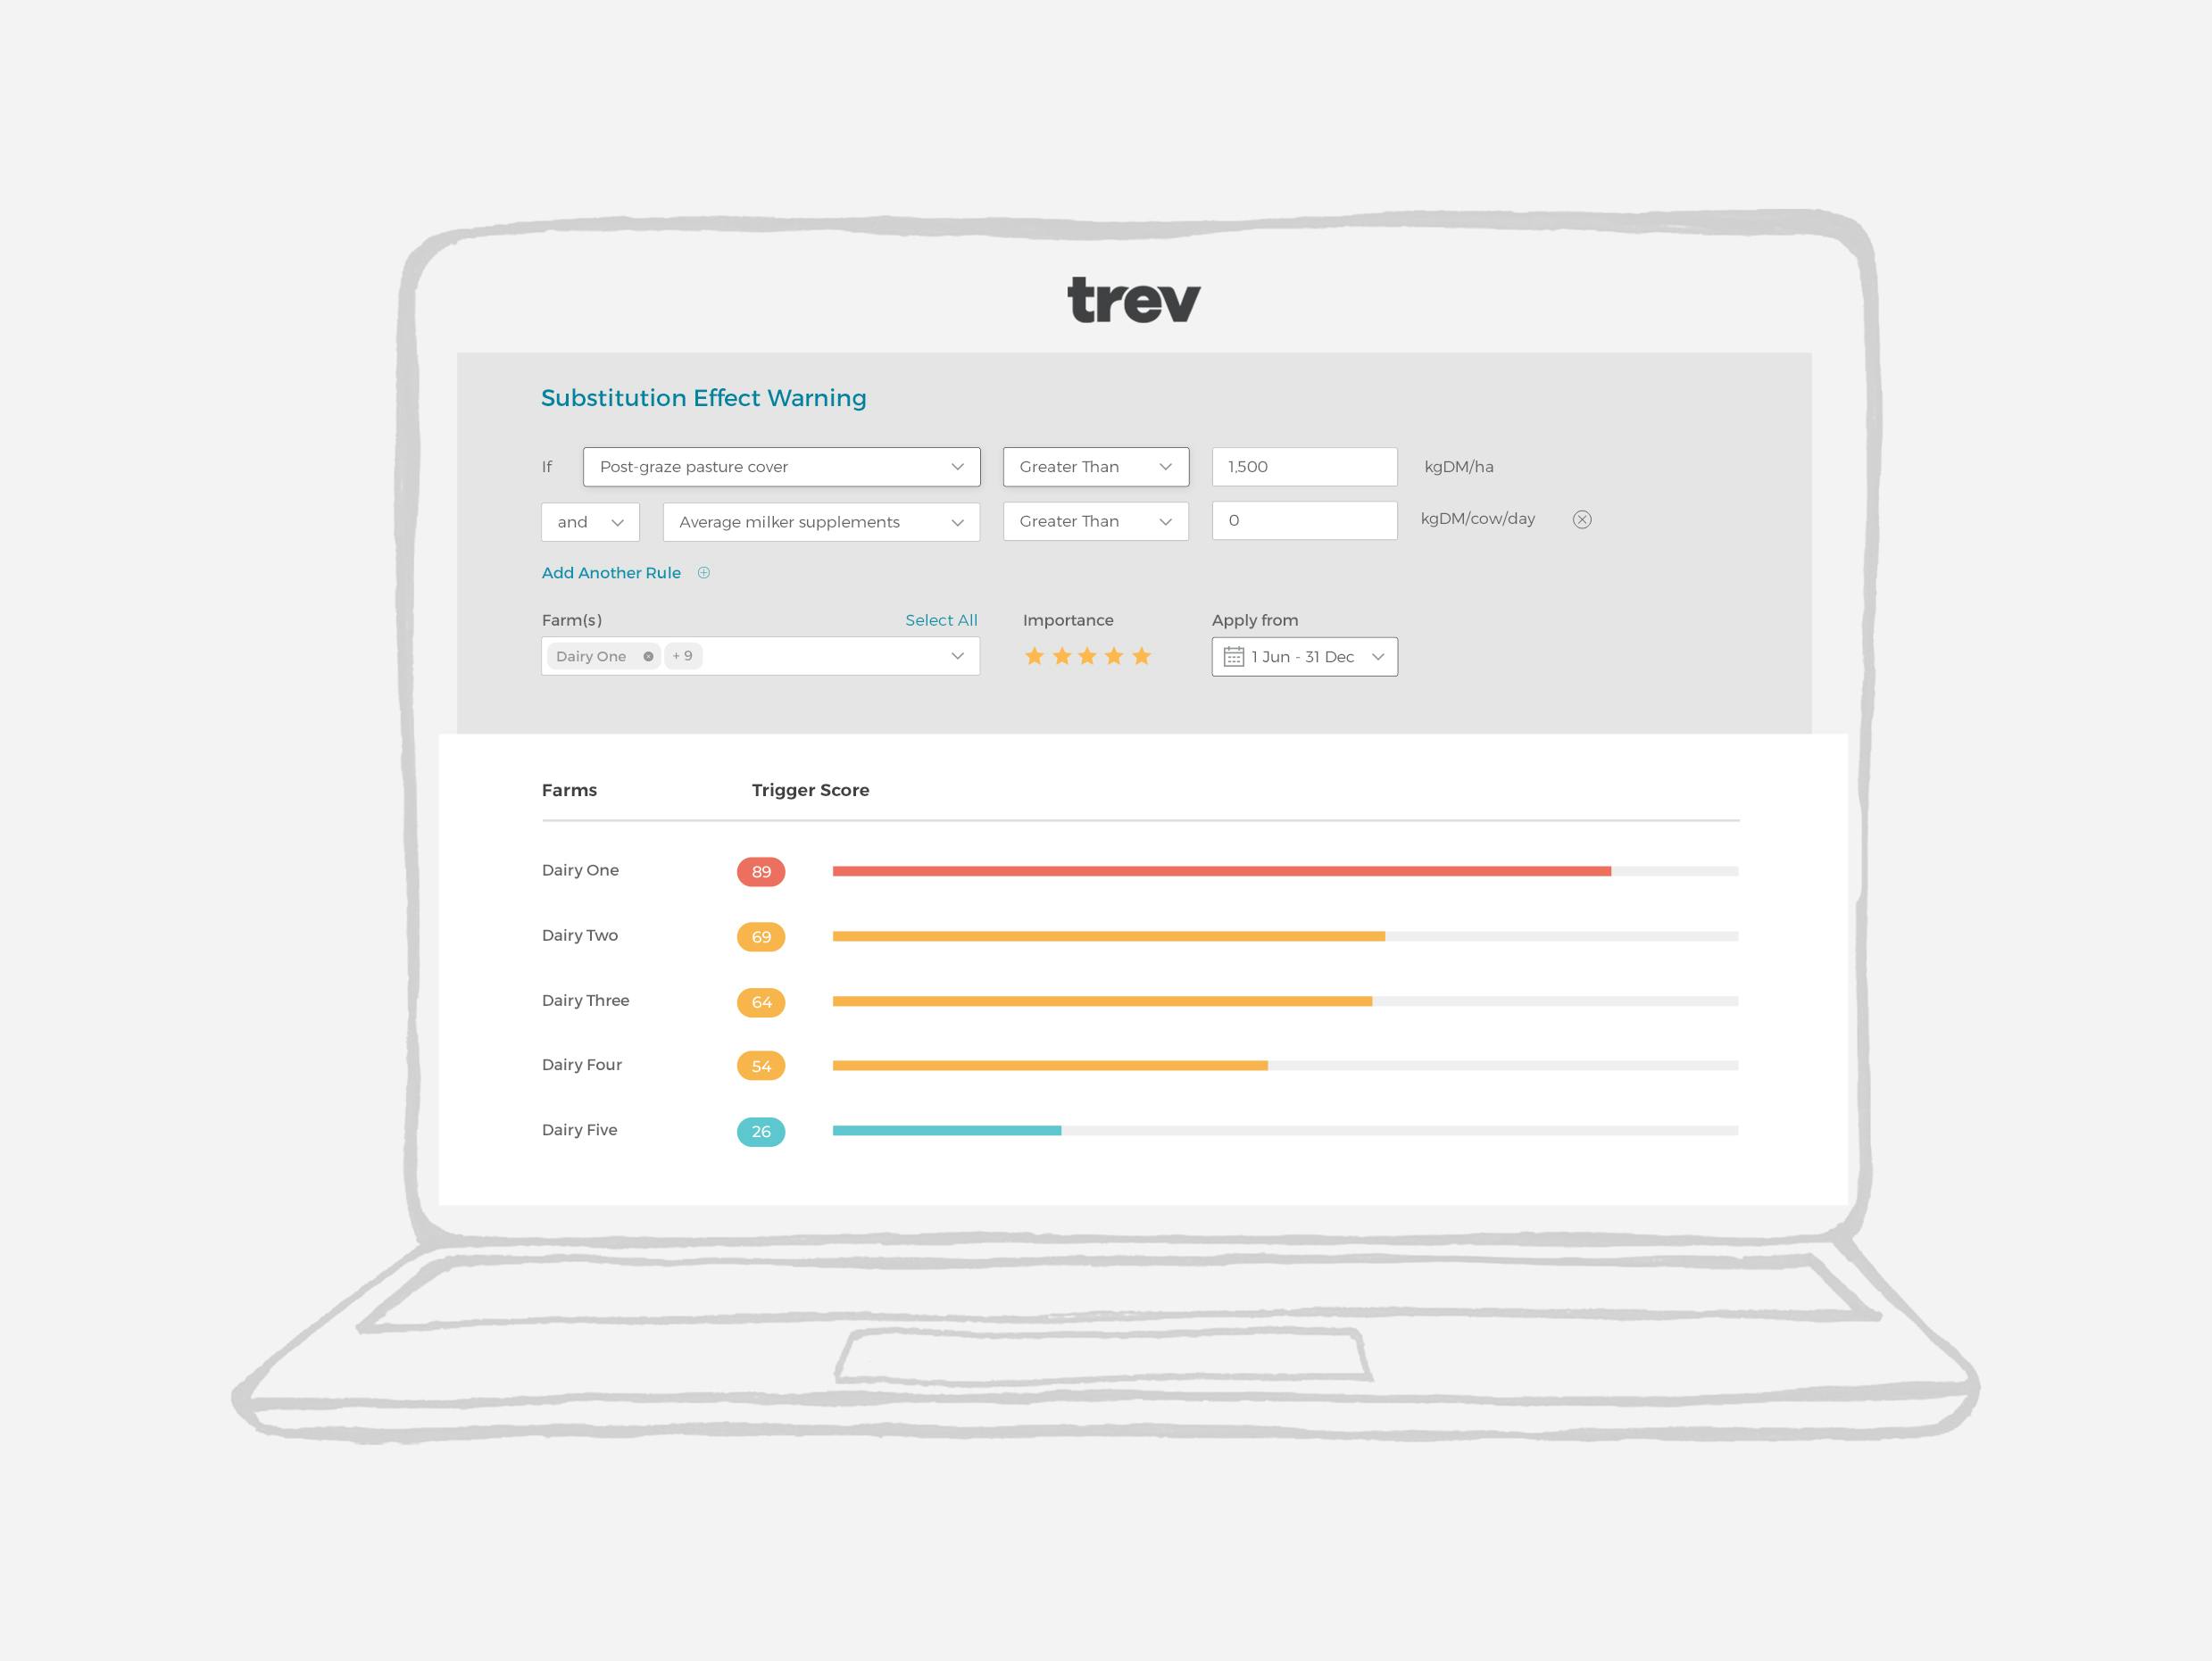
Triggers
Set rule based Triggers to instantly know when peculiarities start to emerge.
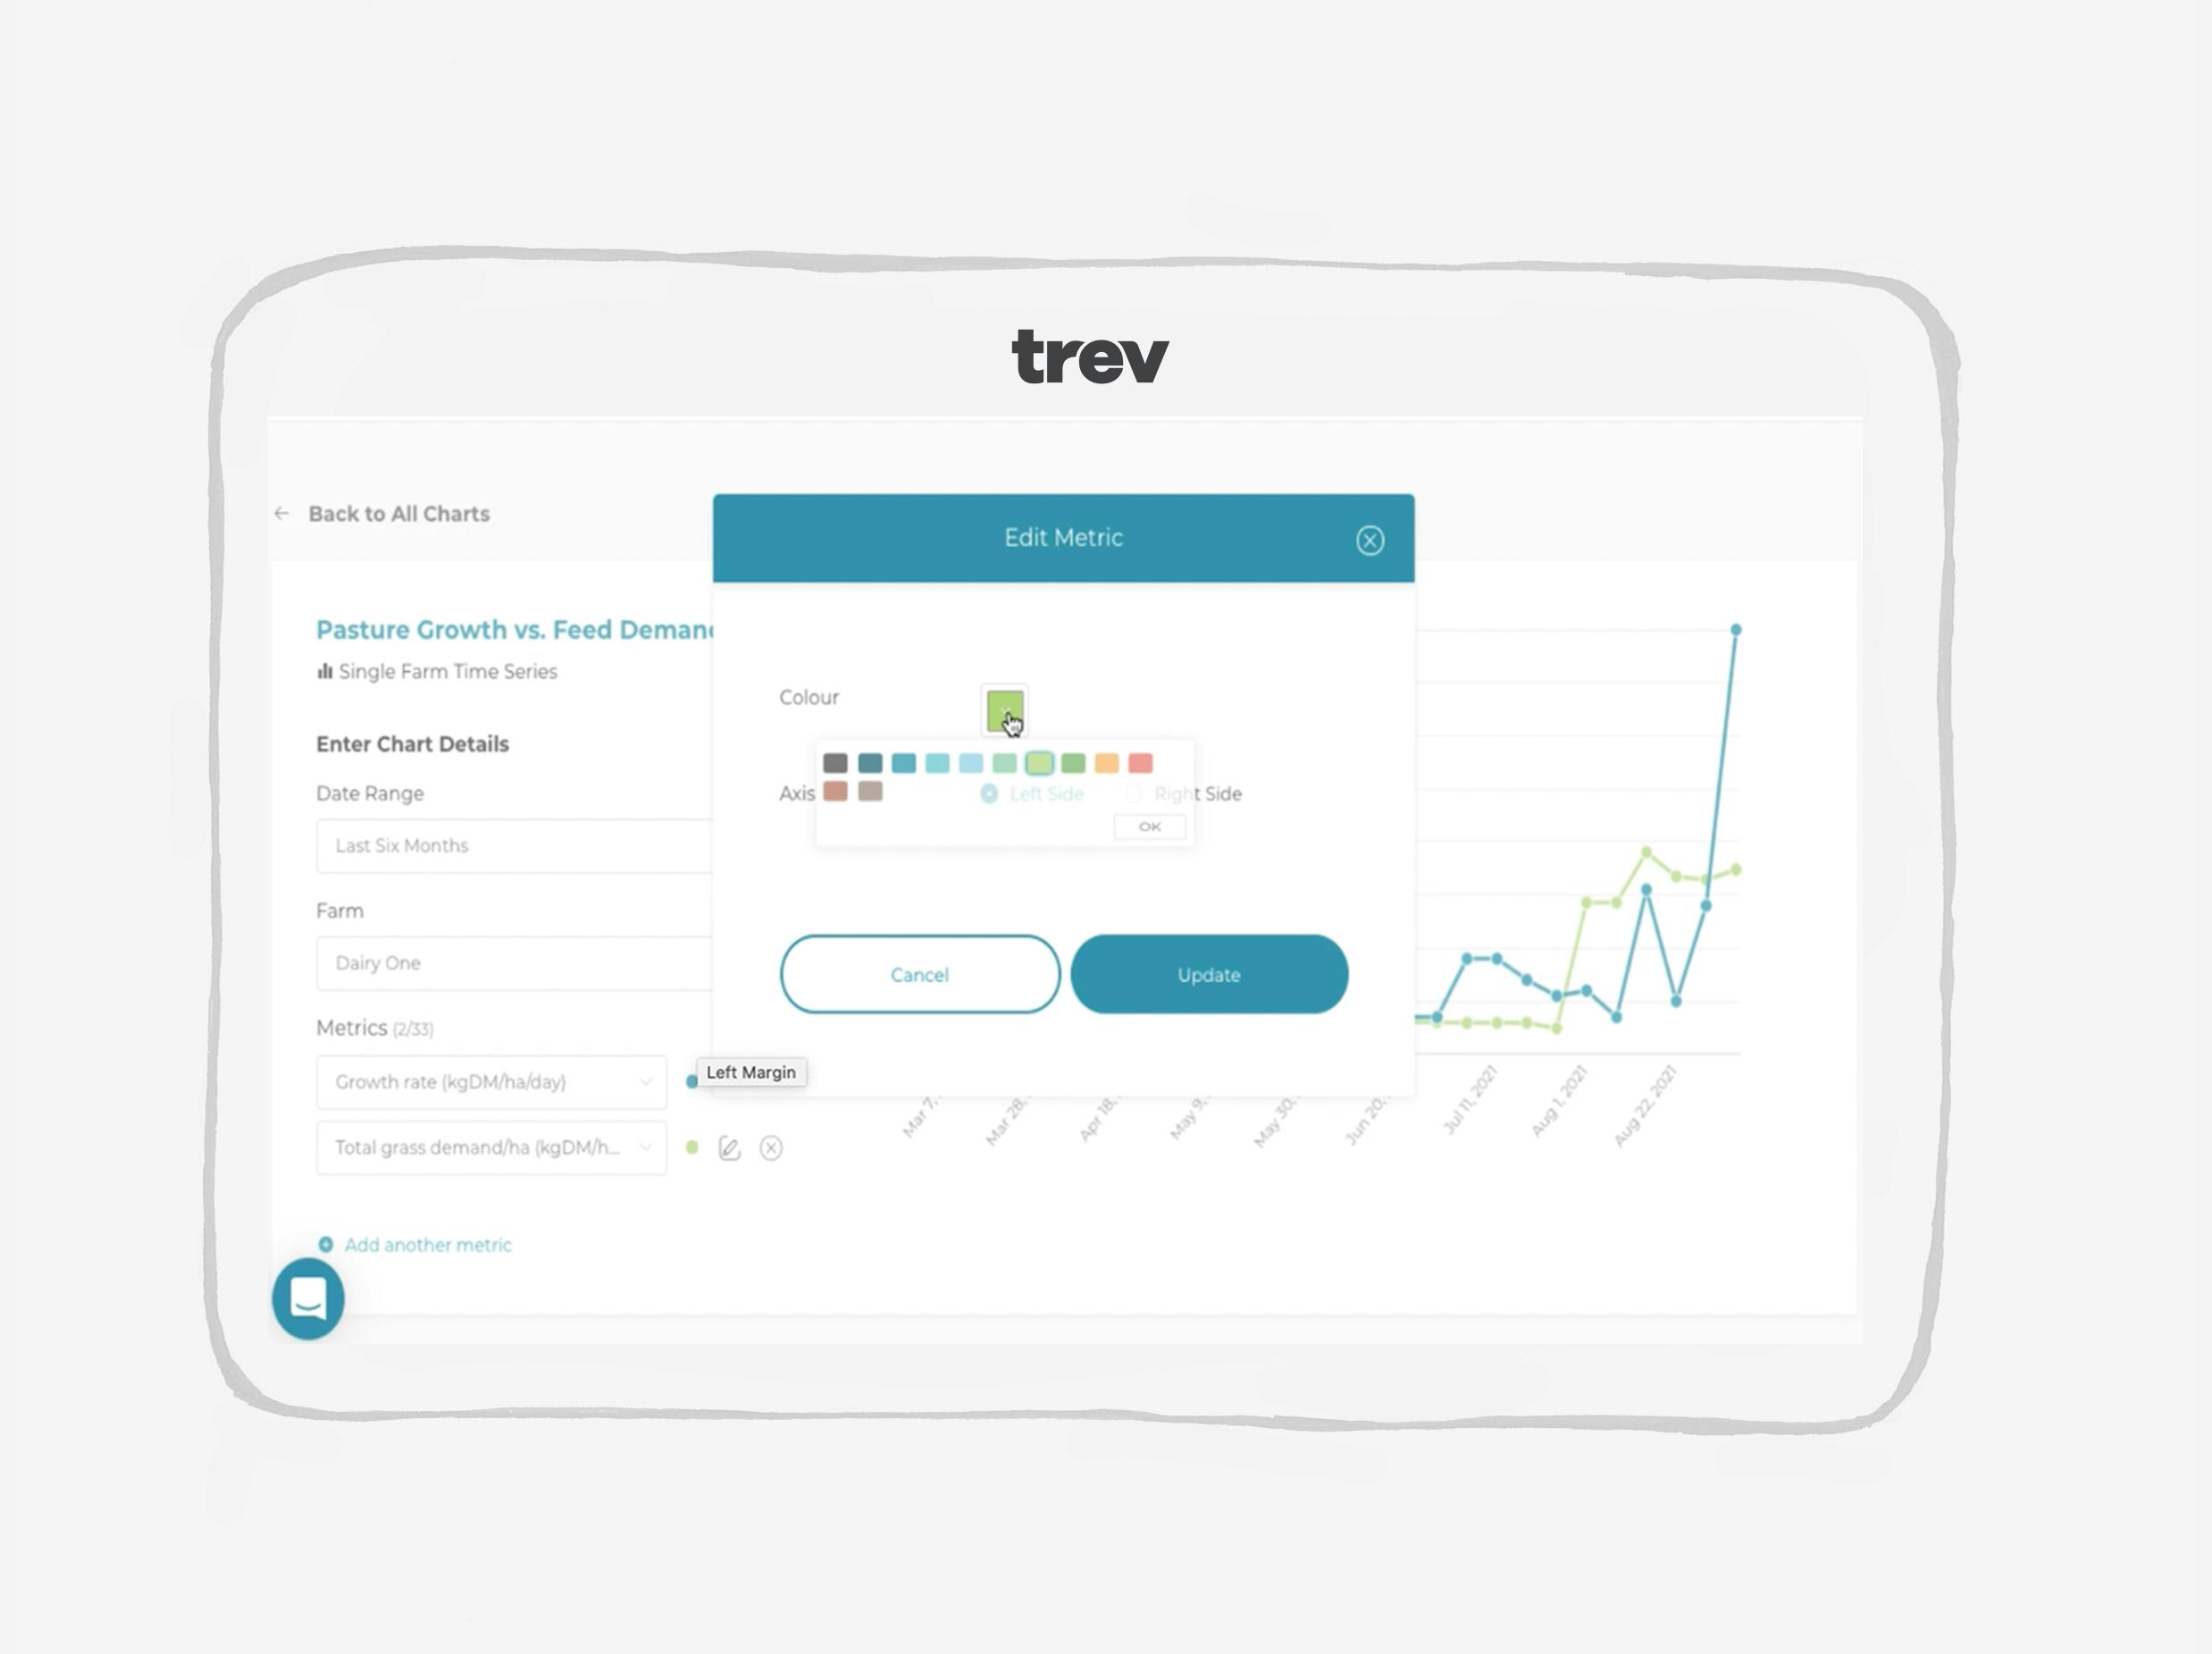
Visualise Individual KPIs
Build and set custom charts and tables to drill into the detail you want to see.
Custom Dashboards
Easily create your own reports with KPIs tailored to your business.
Regional Insights
Your very own virtual discussion group at your fingertips.

Share.
Connect the farm, staff, shareholders, consultants and discussion groups. With Trev, you’re in control of your data and can share what you want with who you want, when you want.
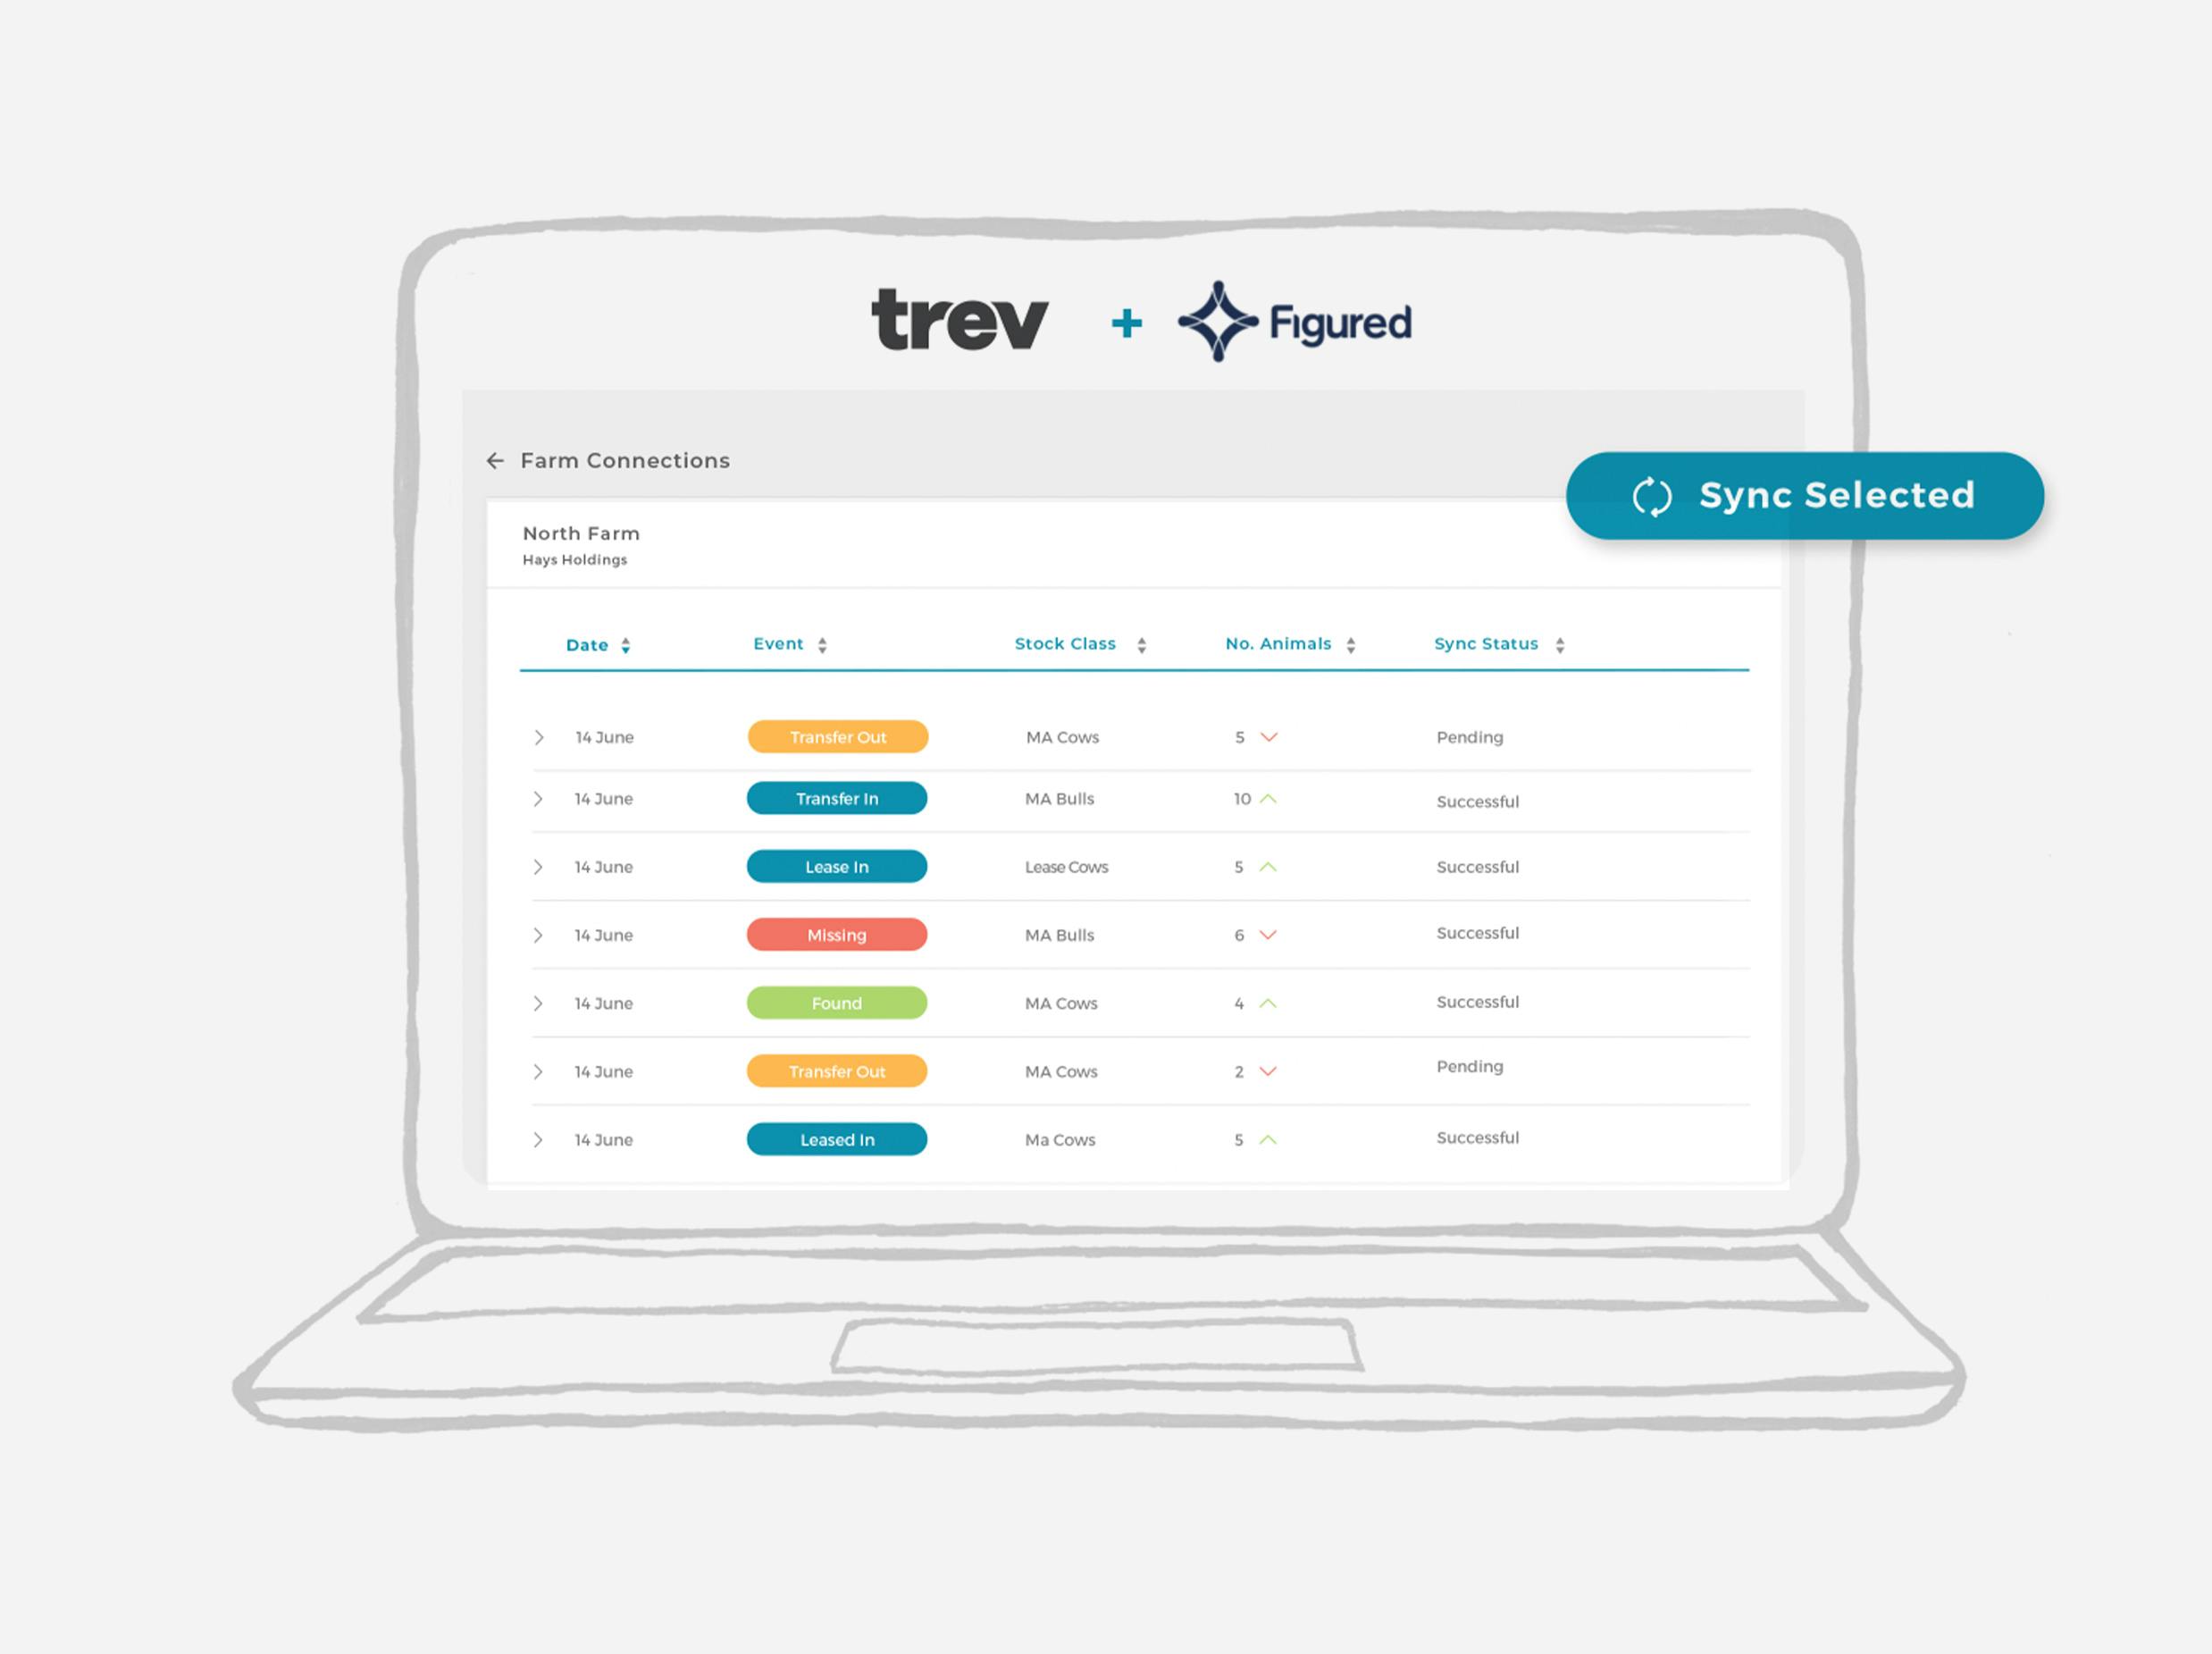
Figured Integration
Pair your farm and financials for top-notch decision making.
MINDA Integration
Bring your animal records into Trev

Trev API
Automatically transfer data to your farm’s internal business system.
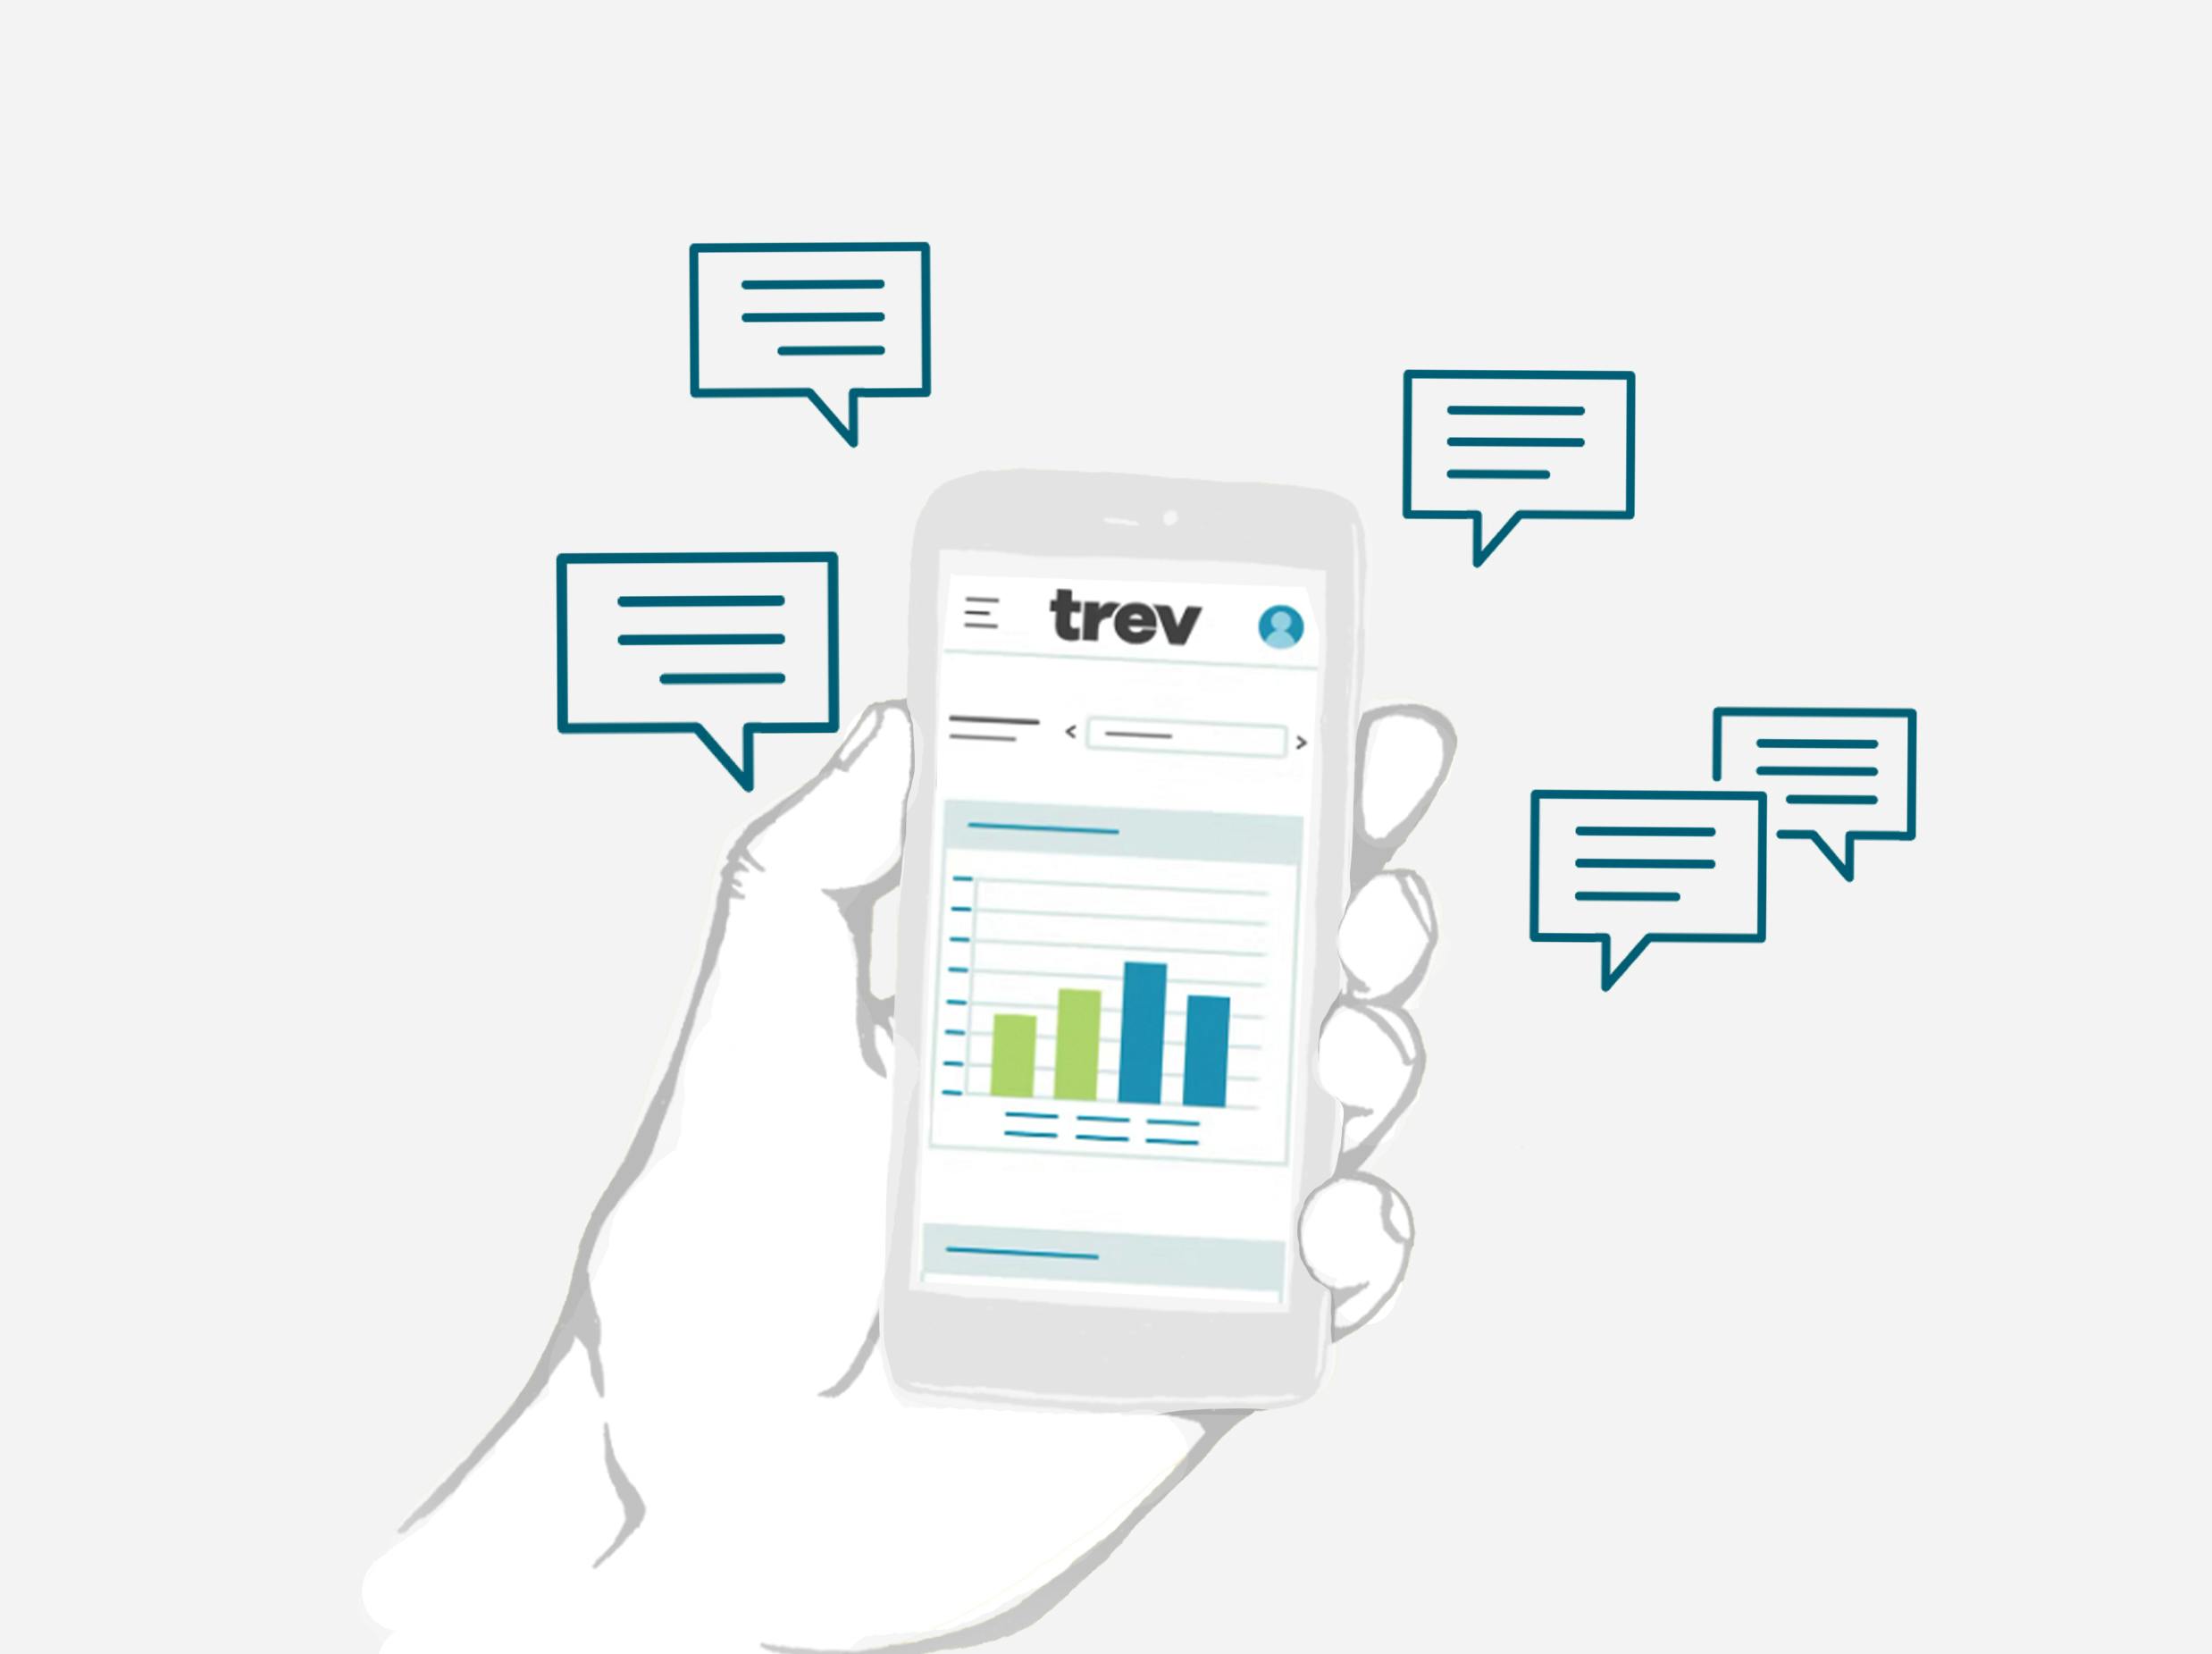
Sharing Your Info
With Trev, you’re in control of your data so you can share what you need to, with who you need to, when you need to.
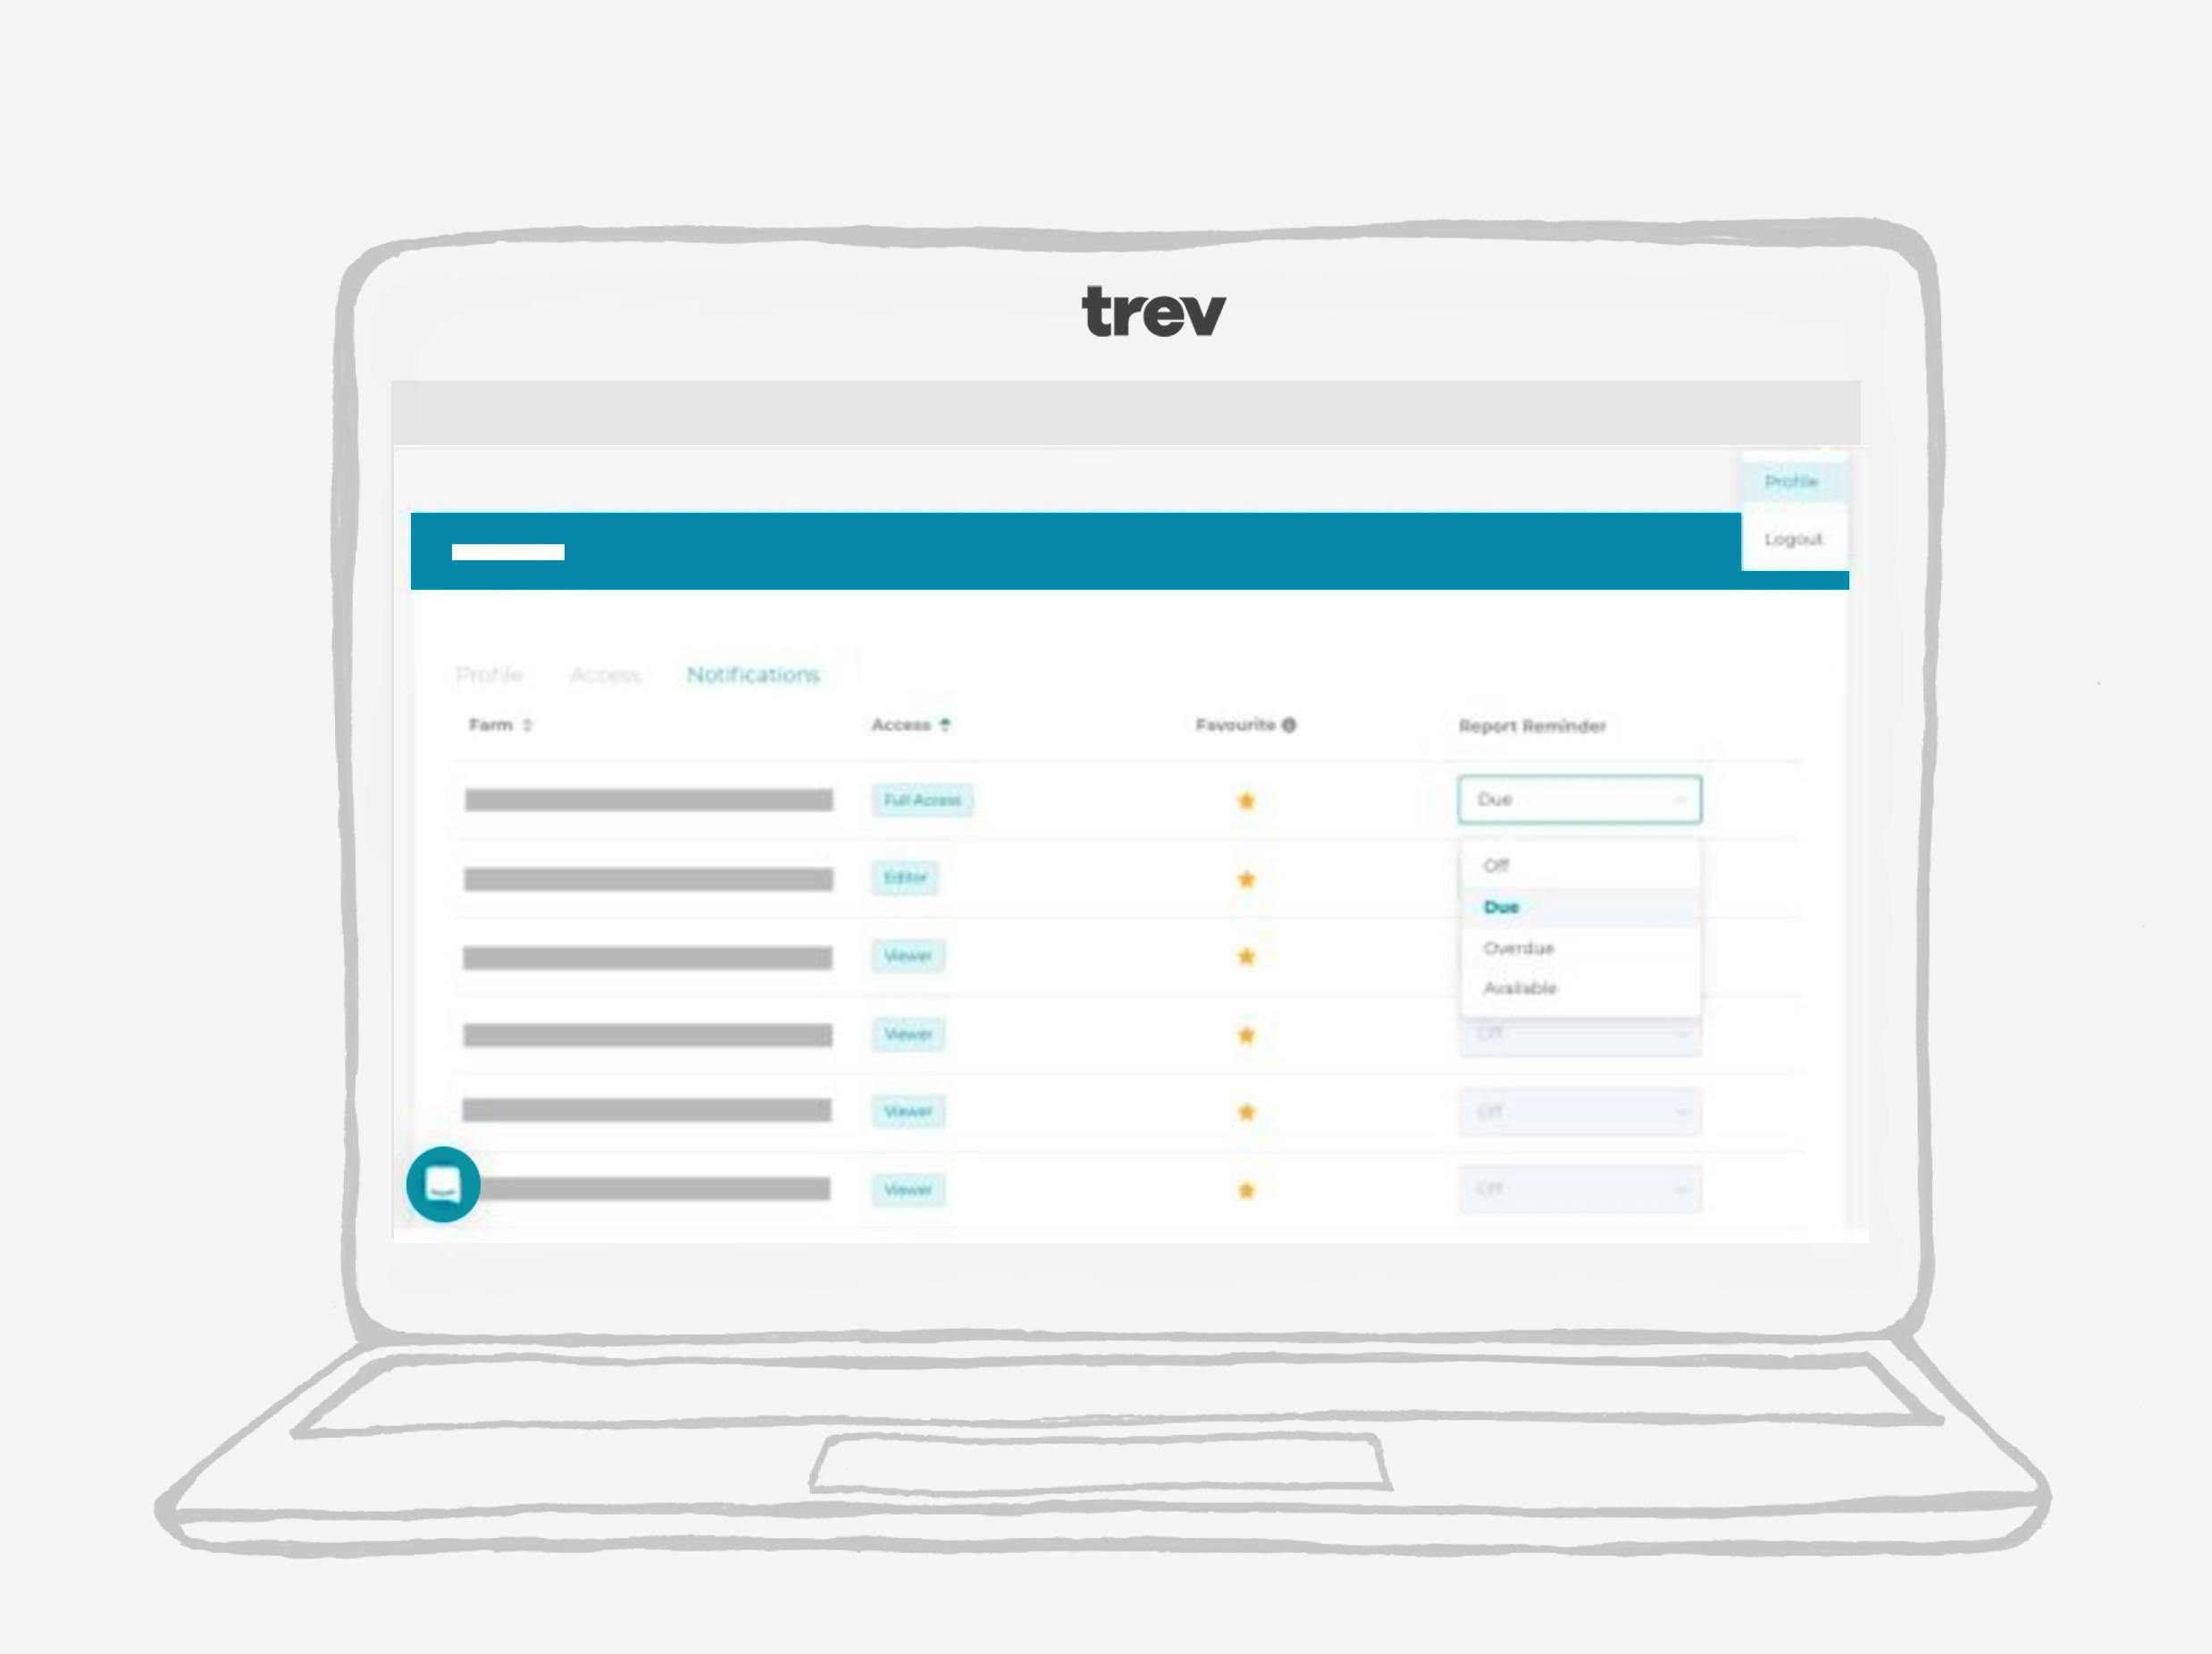
Permissioning
Farm access levels ensure that stakeholders can only see and edit what they need to and nothing they don’t.
Keen to give Trev a whirl?
Get in touch and we'll be back to you in a jiffy.